

Home
Home is a summary of your account over the period set in the time range picker: how many runs succeeded, what failed, which alerts were raised, and whose agents need a look. You’ll come here first thing to decide where to dig in. The page updates live as new data arrives, and every count is for the selected period.
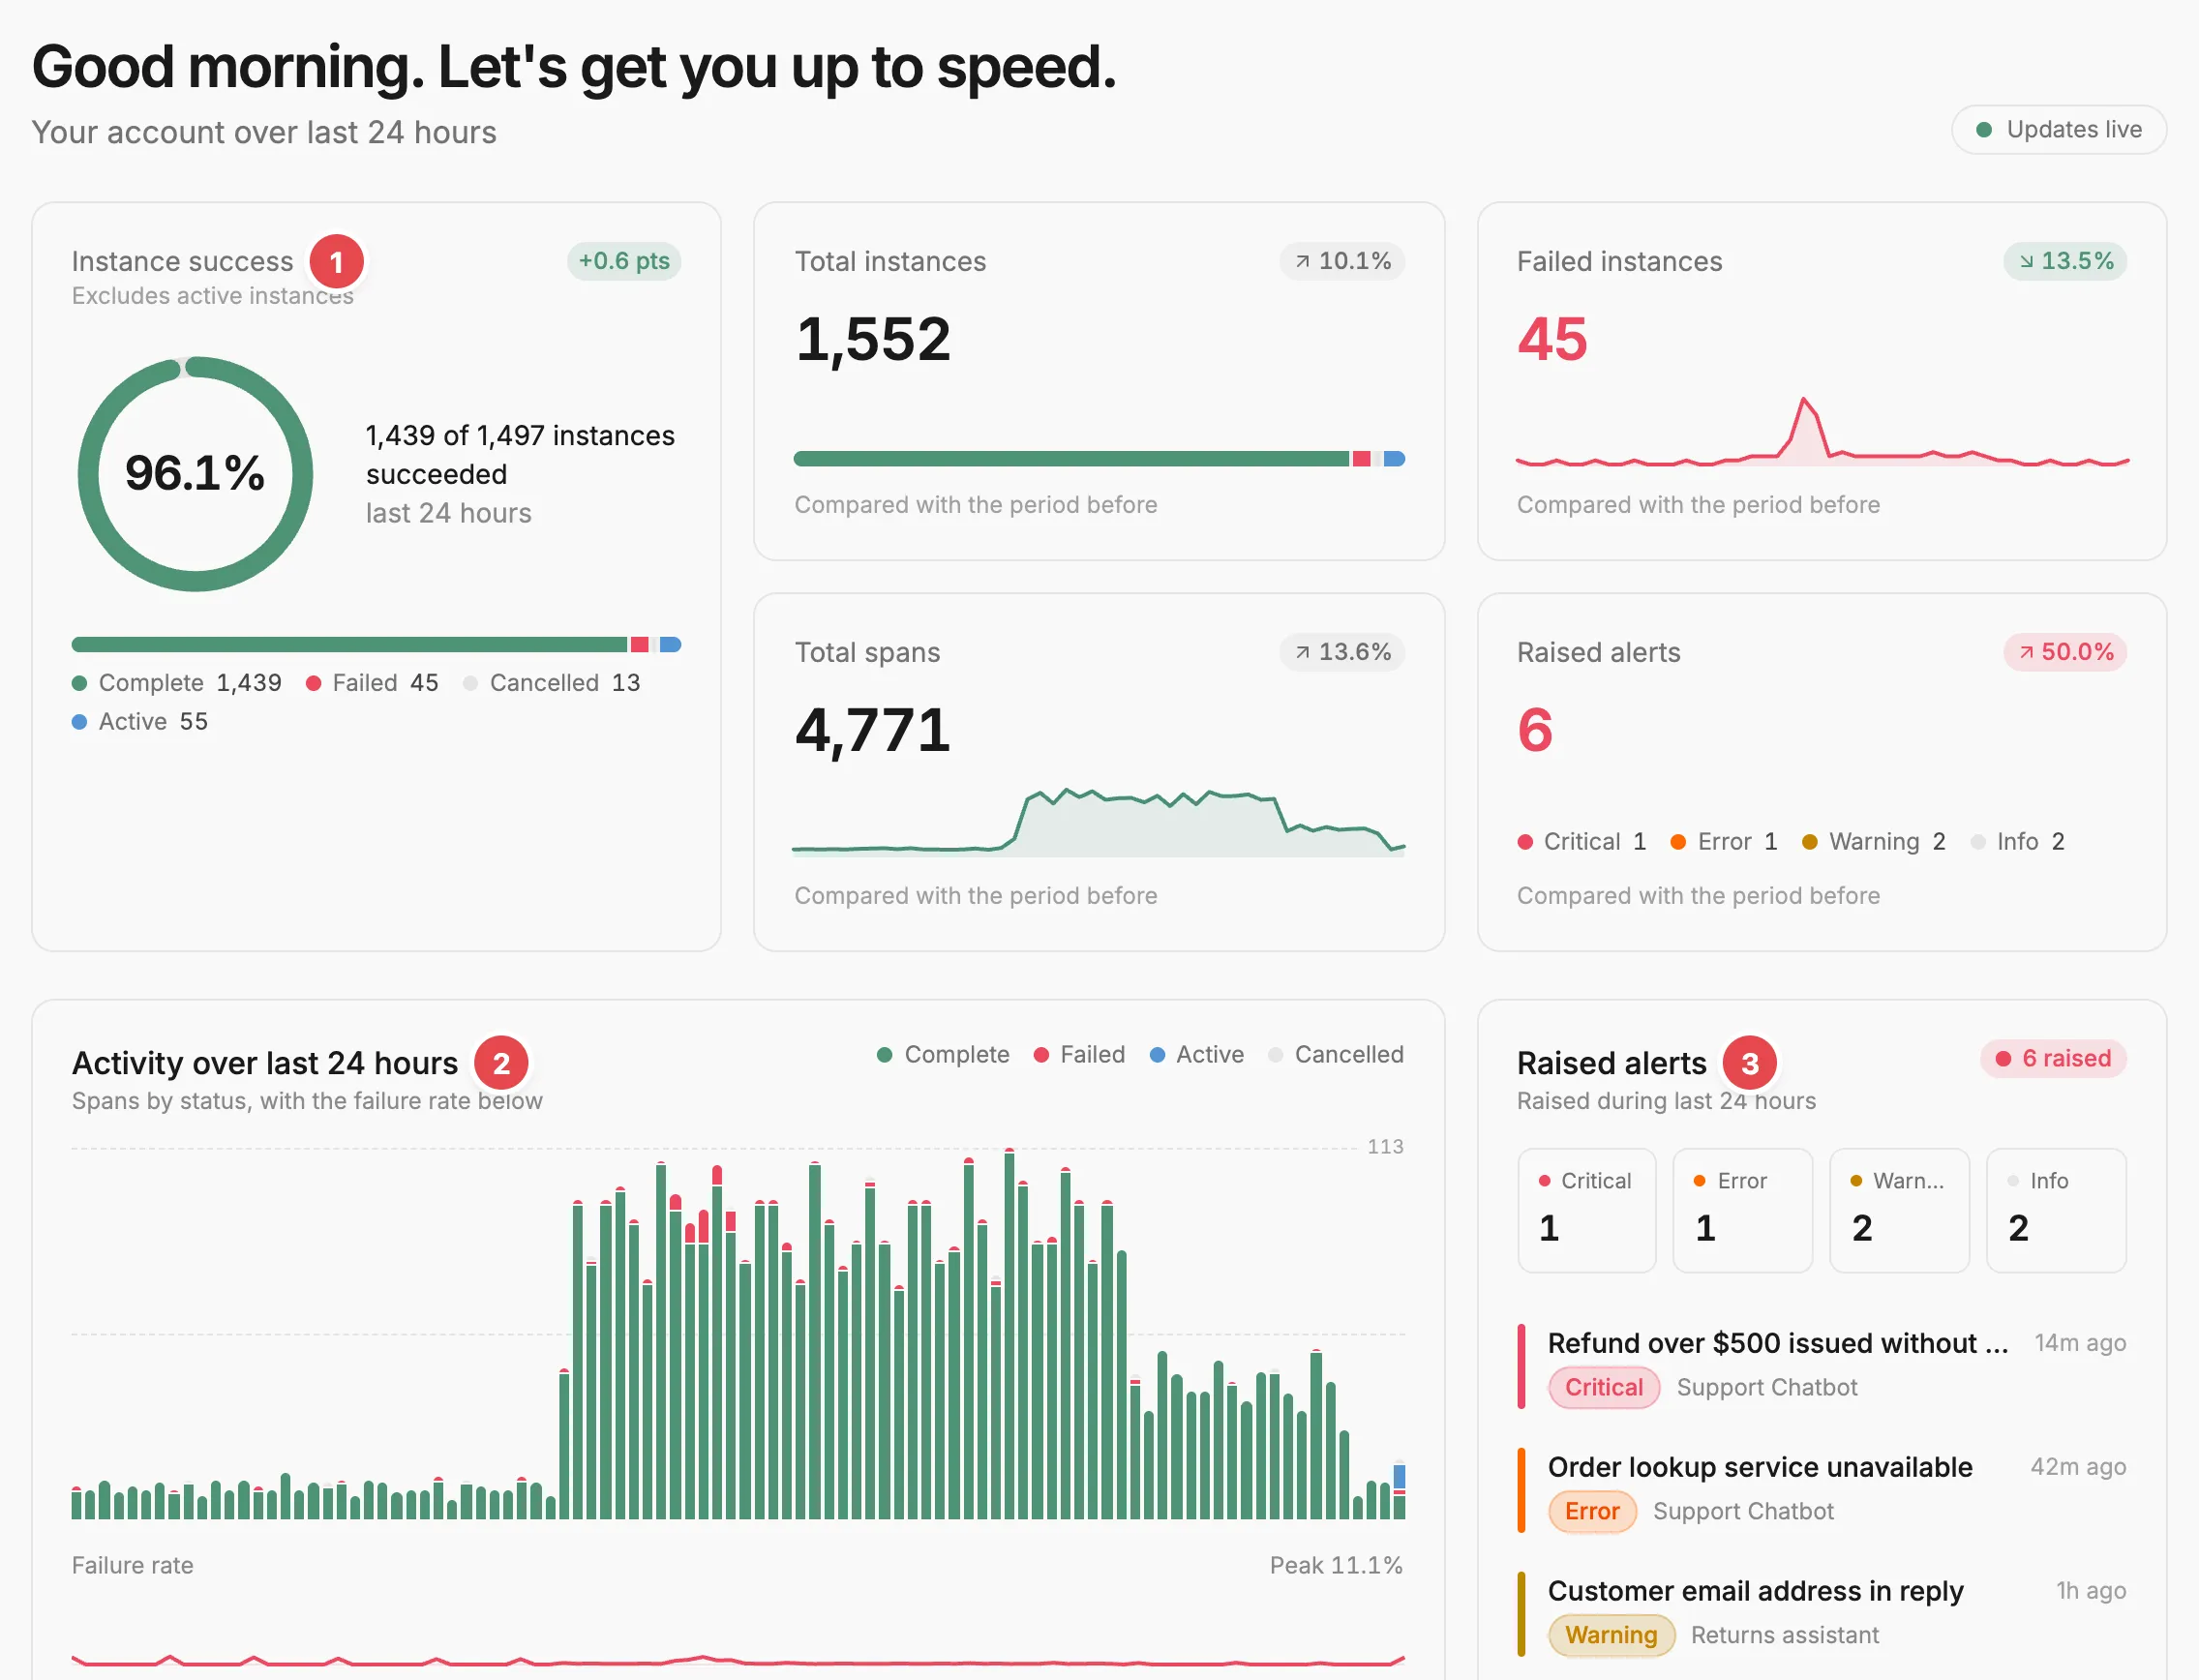
- Instance success - the share of finished runs that completed.
- Activity chart - spans by status, with the failure rate underneath.
- Raised alerts - the alerts still raised, most serious first.
What you can do here
Section titled “What you can do here”- Check the share of runs that succeeded and how that compares with the period before.
- See when spans and failures happened over the period.
- Open a raised alert on the run that raised it.
- Find the agents with failures or alerts, grouped by the person who owns them.
- See which judges ran most, and browse your agents as cards.
At a glance
Section titled “At a glance”The row of tiles at the top gives the headline numbers. Each one shows the change compared with the period before.
- Instance success is the share of finished instances that completed. Active instances are left out, because they haven’t finished yet. The bar below it breaks every instance down into Complete, Failed, Cancelled, and Active.
- Total instances and Failed instances count runs across all your agents. Both open the Agents page.
- Total spans counts every span recorded, and jumps to the activity chart.
- Raised alerts counts the alerts raised, split by severity: Critical, Error, Warning, and Info. It jumps to the Raised alerts panel.
Activity
Section titled “Activity”The activity chart shows spans by status across the period, with the failure rate plotted underneath and its peak called out. Hover a bar to see how many spans fell in that slot and how many of them failed.
Raised alerts
Section titled “Raised alerts”The Raised alerts panel lists the alerts that are still raised and were active during the period, most serious first. It shows five at first. Show n more expands the list, and Show fewer collapses it again. The severity counts above the list are also filters: select one to show only alerts of that severity, and select it again (or Show all severities) to clear the filter.
Each alert opens the Agent instance page › Alerts tab for the run that raised it.
Needs attention
Section titled “Needs attention”Needs attention lists the agents that had failed instances or raised alerts during the period, grouped by owner. Each group shows the owner’s title and teams, and the total alerts and failures across their agents. The owner’s name opens their person page, a team opens its team page, and each agent opens its Agent page.
Agents with no owner are grouped together at the end under No owner. You set an agent’s owner when you register it or from Edit on its Agent page.
Judges
Section titled “Judges”If your account has judges, the Judges panel ranks up to eight of them by how many instances they ran in the period. Each row shows the judge’s share of all judge instances, its success rate, whether it runs On completion of the agents it scores or On demand, and the agents it’s linked to. View all judges appears when there are more than eight.
Agents
Section titled “Agents”The Agents section shows up to eight of your agents as cards, ordered by the sort menu: Needs attention (the default), Most recently active, Name (A to Z), Status, or Most failures. Each card shows the agent’s status and when it was last active, its owner, its instance count and success rate, its median run duration with the 95th percentile beside it, and how its instances ended. Cards for agents with failures or alerts are outlined in red. A card opens its Agent page, and View all agents opens the full Agents page.
Related
Section titled “Related”- Web app overview — the sidebar, the time range picker, and where each area lives.
- Check agent health — work through the agents that need attention.
- Triage alerts — review and resolve raised alerts.
- Instance — what a run is and how its status is set.
- Alert — what raises an alert and what its severity means.