

Activity tab
Every span a run recorded is listed here, so you can follow what the agent did step by step and open any step to see what it received and returned. The Agent instance page opens on this tab.
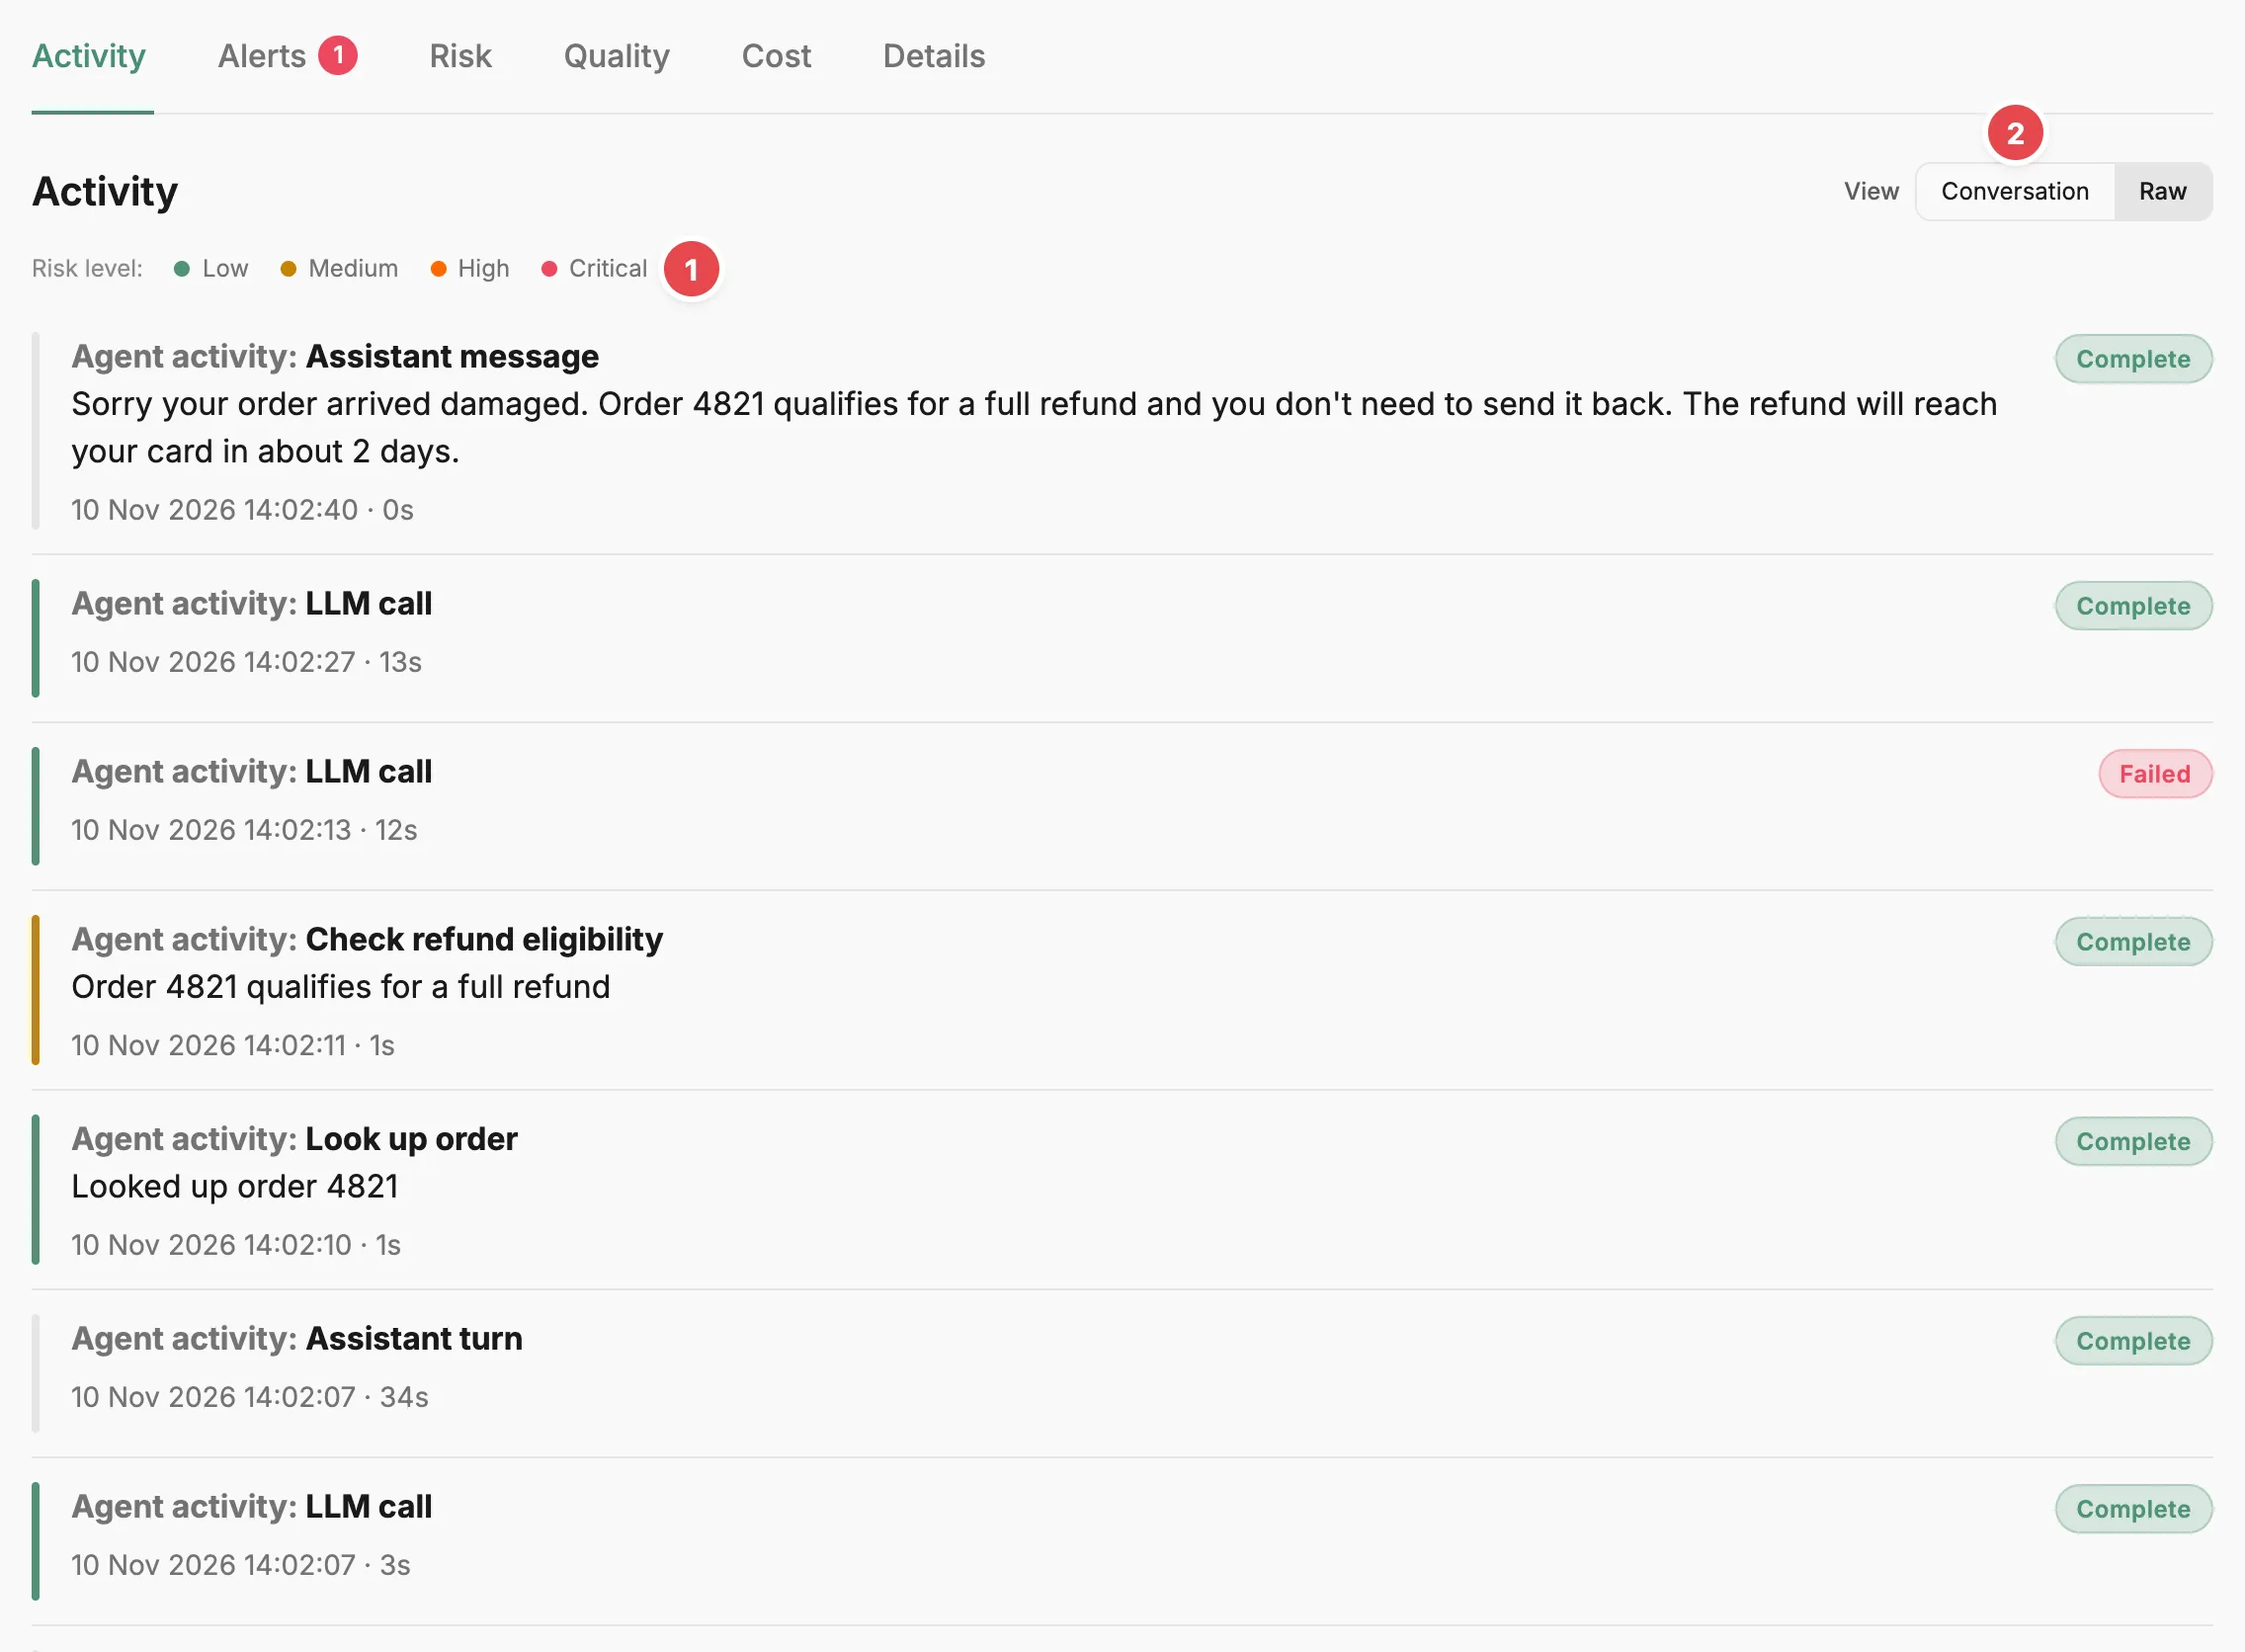
- Risk level - maps the colour bar on each card to a risk level.
- View - switches between the Conversation and Raw layouts.
For what sits above the tab row, see the Agent instance page.
Raw view
Section titled “Raw view”The raw list shows one card per span, newest first, split into pages when the run has many spans. Each card’s title is the span type, prefixed by the span’s purpose: “Agent activity:”, “Quality activity:”, or “Alert activity:”. Under the title is a one-line summary, rendered from the span type’s summary template when it declares one, then the span’s timing and a status badge. Hovering a card reveals View; selecting the card opens the span panel.
A span is Active, Complete, Failed, or Cancelled. Spans never use Terminated, which is for instances only. An Active span shows its start time, Complete and Failed spans show start and finish times, and a Cancelled span shows when it was cancelled.
When the agent has a risk profile, a coloured bar down the left of each card shows the span’s risk level, and a Risk level legend above the list maps the colours to Low, Medium, High, and Critical.
Conversation view
Section titled “Conversation view”When the run’s spans come from a recognised conversational integration, the tab opens in a Conversation layout instead of the raw list. The recognised integrations are the OpenClaw plugin, the AI SDK, GitHub Copilot, the Claude SDK, LiveKit, LangChain, and the spans a hosted judge records. A View switch above the list moves between Conversation and Raw. Prefactor reads a run through one integration at a time; spans from any other integration in the same run appear as custom span cards.
The conversation lists the newest item first, with a divider where the date changes. Selecting an item opens its span panel.
- User and assistant messages appear as chat bubbles, with Thinking and System cards for reasoning and system prompts.
- Tool call and Tool result cards show a one-line preview of the input or output.
- LLM call cards show the provider and model, with the span’s start time.
- User turn and Assistant turn dividers mark where each turn starts, numbered when the integration reports a turn index.
- Custom span cards show the summary of any span the conversation has no dedicated card for.
Each item reflects its span’s status. An active item pulses, a failed item is tinted red (cards also get a red border), and a cancelled item is dimmed. A complete item has no extra marking. When the agent has a risk profile, each item also shows its risk level.
Token usage appears on the item the integration attaches it to. On an LLM call card, the input and output token counts and the percentage of the model’s context window used sit beside the model name. Integrations that report usage once per turn show the counts on the Assistant turn divider instead.
Span panel
Section titled “Span panel”Selecting a span opens its panel over the list. The heading repeats the span’s purpose and type, with its risk level and score (when the agent has a risk profile), its timing, and its status. Previous and Next step through the run’s spans without closing the panel; the left and right arrow keys do the same.
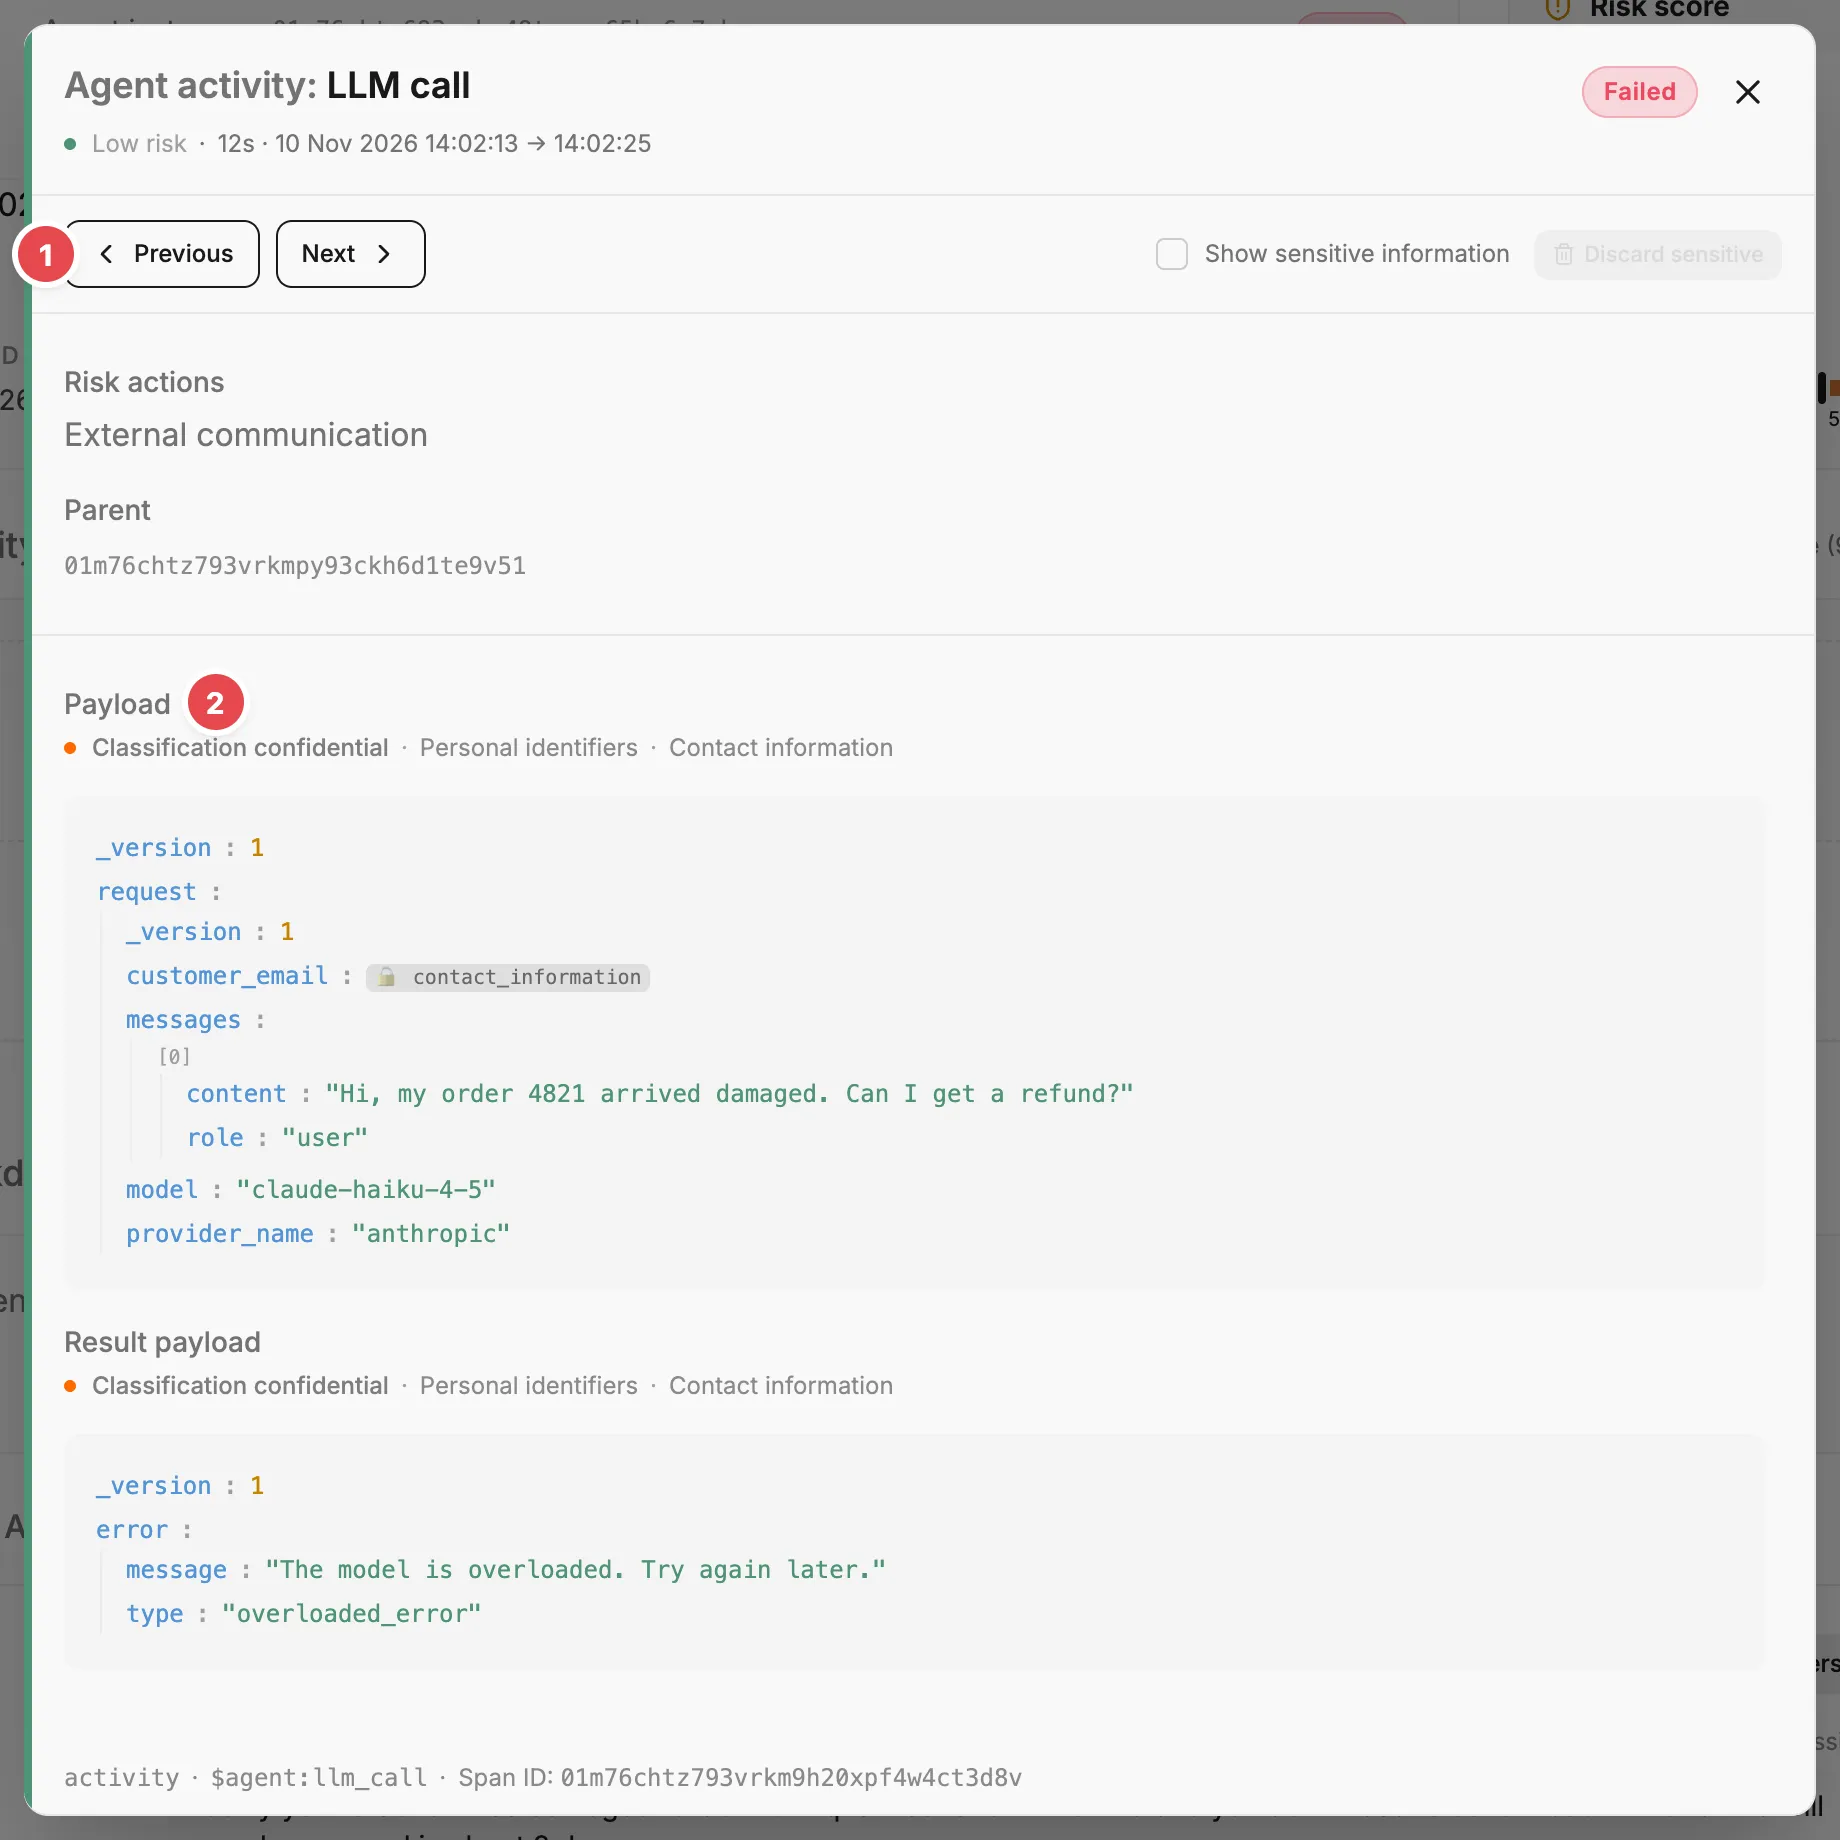
- Previous - steps to the previous span; Next steps forward.
- Payload - what the span received, as an expandable JSON tree.
The body shows, when they apply:
- The span’s one-line summary.
- Risk actions — the actions the span type is allowed to perform under the risk profile.
- A warning when authentication credentials or secrets appear in the span’s output, which the profile treats as a separate escalation.
- Parent — the ID of the parent span.
- Payload — what the span received.
- Result payload — what the span returned. It only appears when the span recorded a result.
Both payloads are laid out as a JSON tree you can expand and collapse. With a risk profile, each payload also shows its data classification and the data categories it contains. The footer gives the span’s purpose, its span type name, and its Span ID.
The panel doesn’t show child spans. To see a child, open it from its own place in the list.
Sensitive values
Section titled “Sensitive values”Values your integration marked as sensitive are redacted: a placeholder names the data categories in place of the value. When the span holds sensitive values, Show sensitive information appears in the panel’s toolbar. Tick it to reveal them until you leave the tab.
Discard sensitive sits beside it. It is disabled until you reveal the values, then opens a “Discard sensitive data” dialog. Confirming with Discard sensitive data permanently deletes the stored values. The span keeps its category labels, so the record still shows what kind of data was present, but nobody can view the values again. This can’t be undone.
Related
Section titled “Related”- Investigate a run — find a run and read what each step did.
- Span — what a span records, span types, and payload structure.
- Sensitive data — how marked values are stored, redacted, and discarded.
- Instance — the instance that owns these spans.
- Evals — how judge runs, whose conversations use this layout, relate to the runs they score.
- Agent instance page — the strip above the tabs, including the risk score card and Terminate.
- Agent instance page › Risk tab — how the instance’s total score is composed.