

Investigate a run
When a run failed, raised an alert, or scored higher risk than you expected, you’ll want to see exactly what the agent did. This guide takes you from the agent list to the span that explains it.
By the end you’ll have the run open, know which steps it took and what each one received and returned, and know where its risk score, alerts, and quality verdicts came from.
Before you start
Section titled “Before you start”- The agent is instrumented with a Prefactor SDK and has recorded at least one run. If it hasn’t, start with the Quickstart.
- You’re signed in to the account the agent belongs to.
Find the run
Section titled “Find the run”-
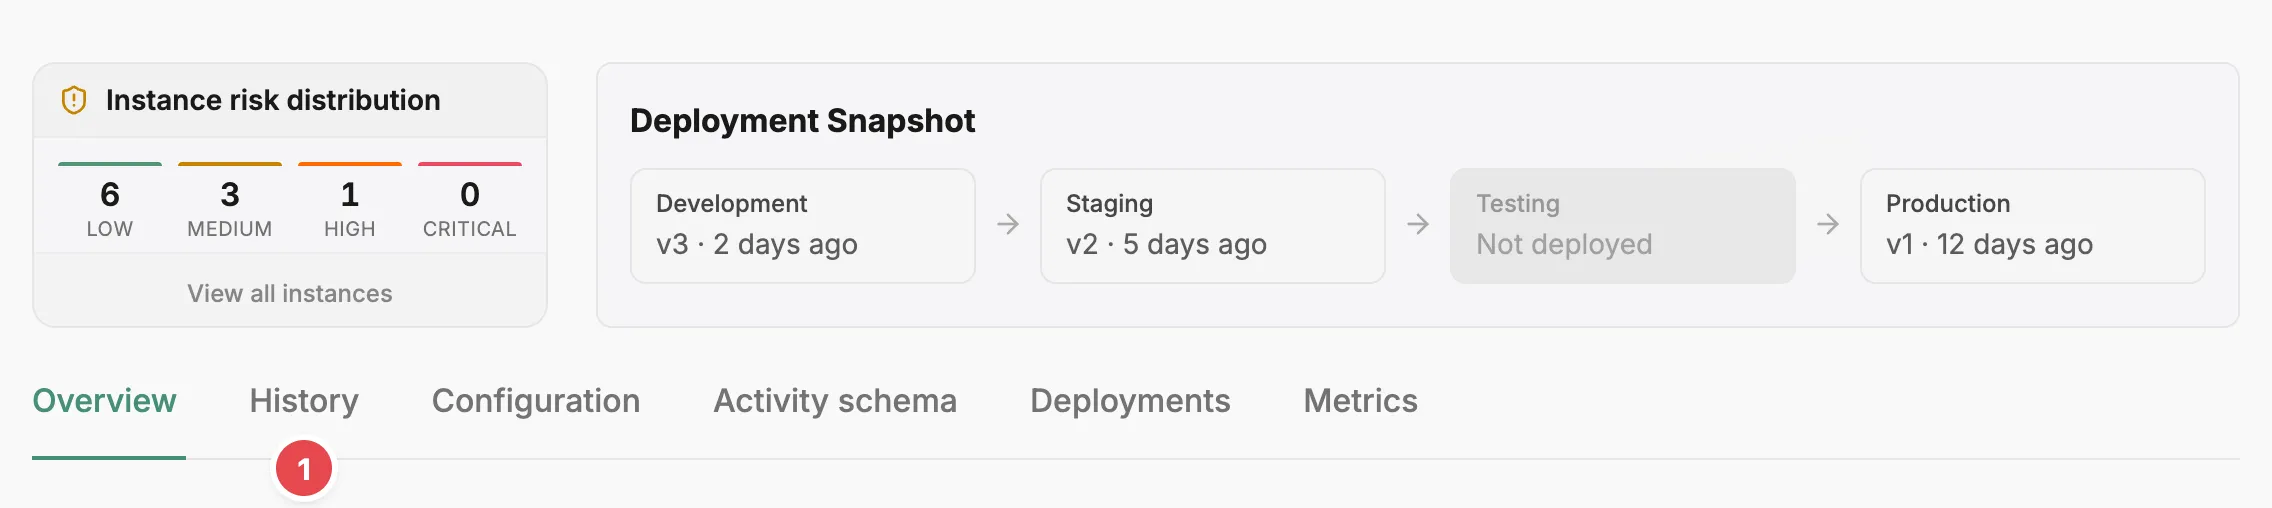
Go to Agents, select View details on the agent’s card, then select the History tab 1.
The Agent page opens. If the agent has a risk profile, the strip above the tabs shows how many of its runs fell into each risk level.
-
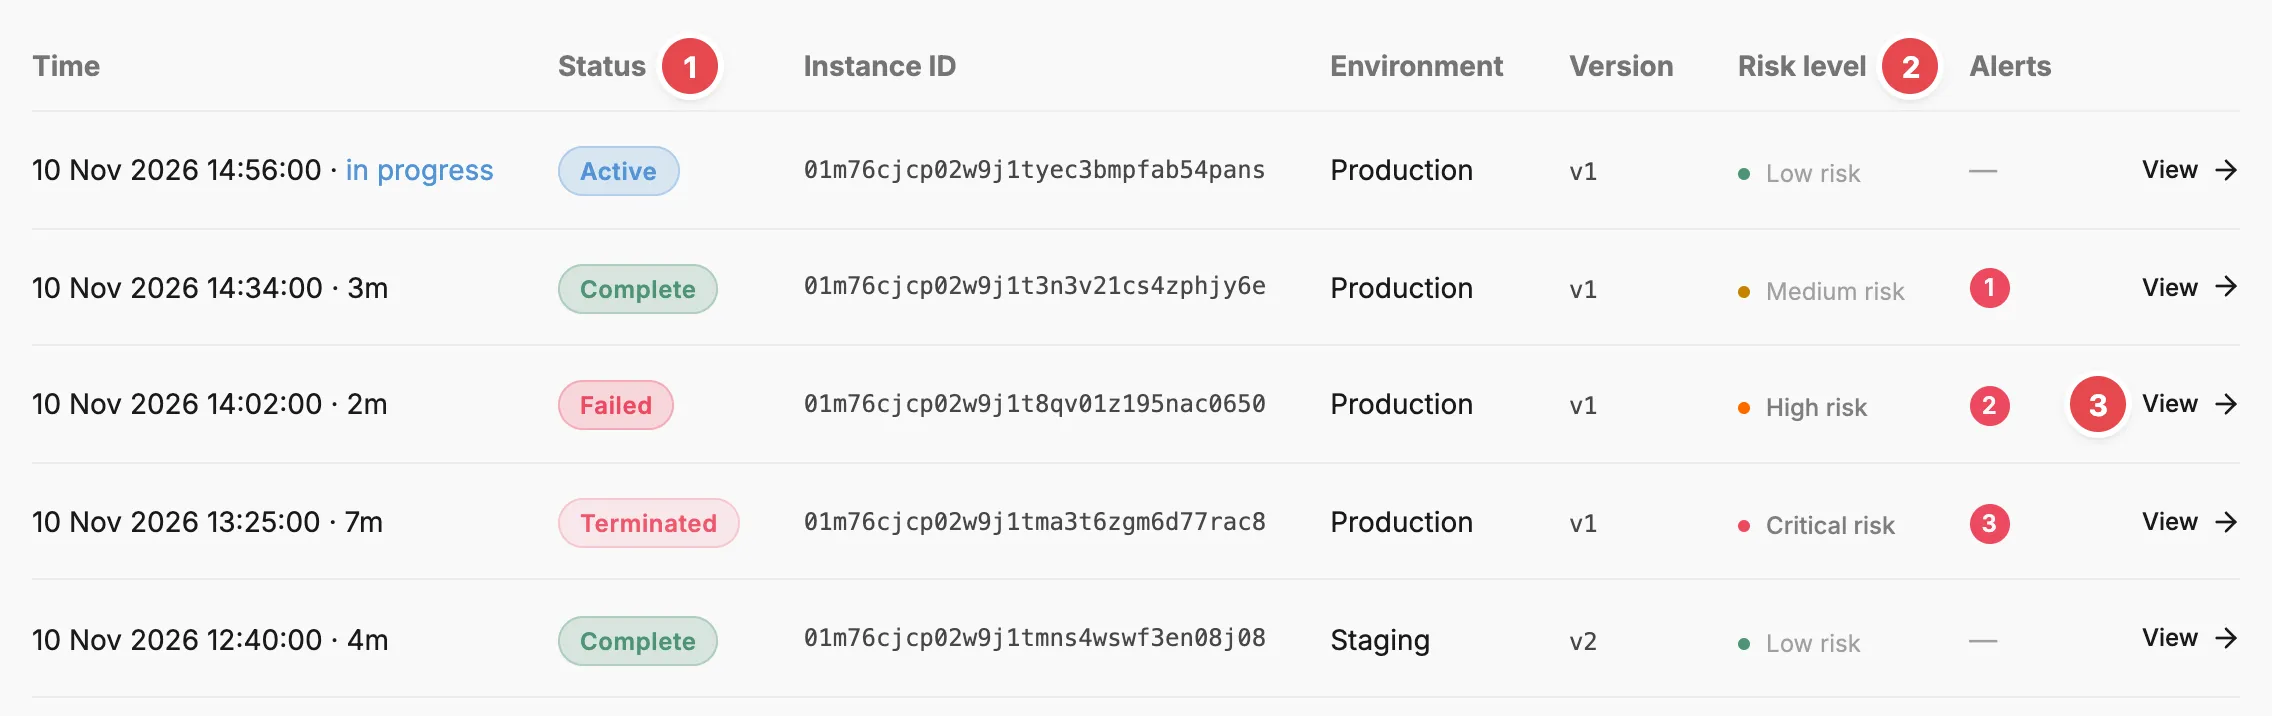
Find the run you’re after and open it.
Every run of this agent is listed, newest first. Use the Status 1, Risk level 2, and Alerts columns to spot the run. Failed and Terminated runs, High or Critical risk levels, and a non-zero alert count are the usual starting points. Then select View 3 on its row.
-
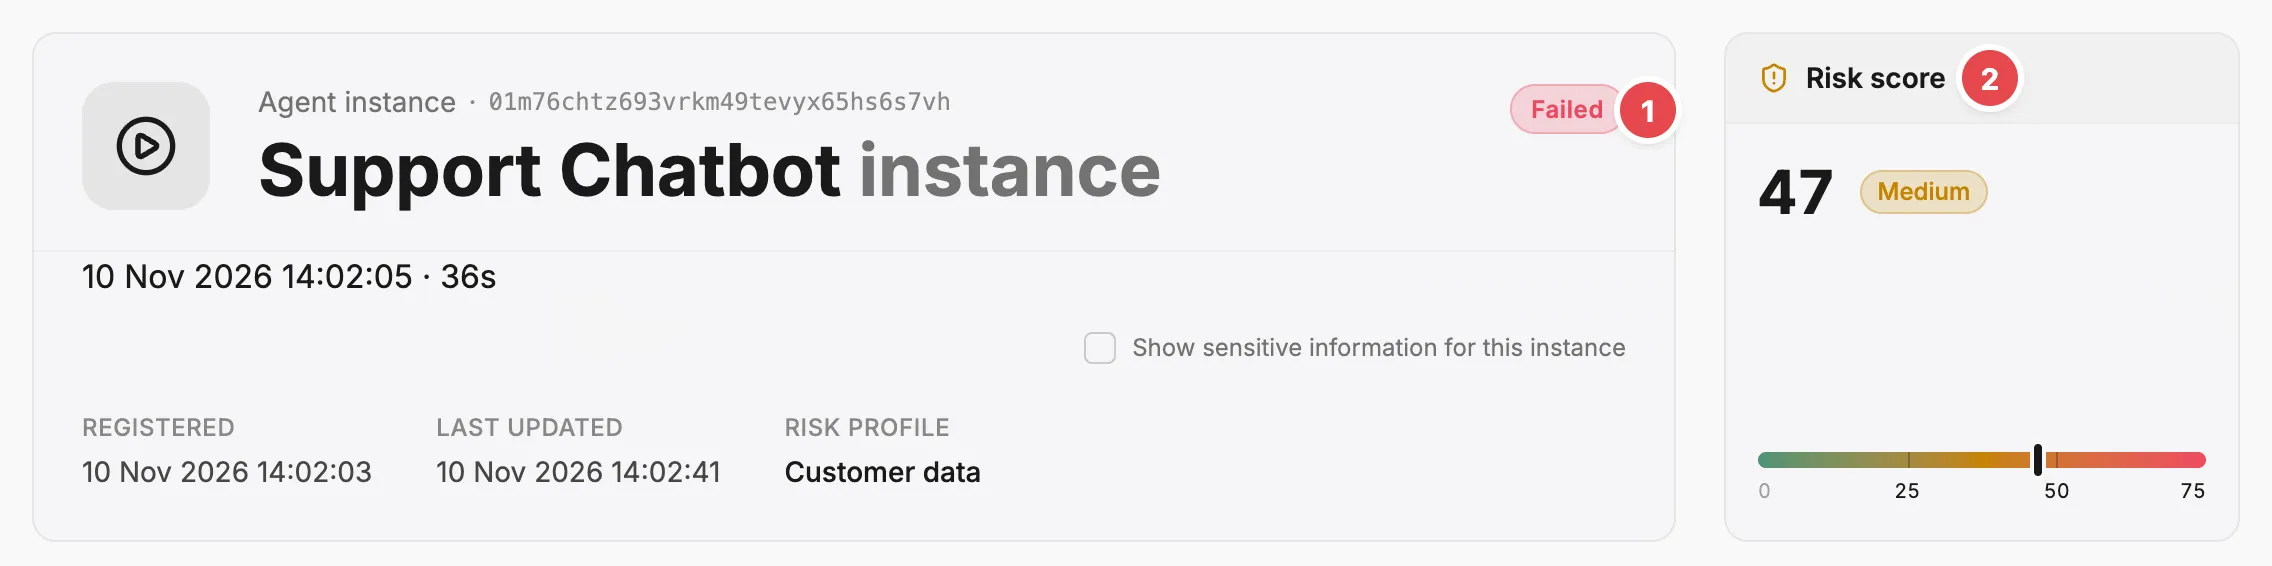
Check the run’s status and risk score.
The Agent instance page opens on the Activity tab. The strip at the top shows the run’s status, such as Failed 1, when it ran, and its Risk score 2. Test runs carry a Smoke test or Eval pill; live runs have none. Below the strip are a span activity chart and, when the run recorded LLM token usage, a cost breakdown.
Read what the agent did
Section titled “Read what the agent did”-
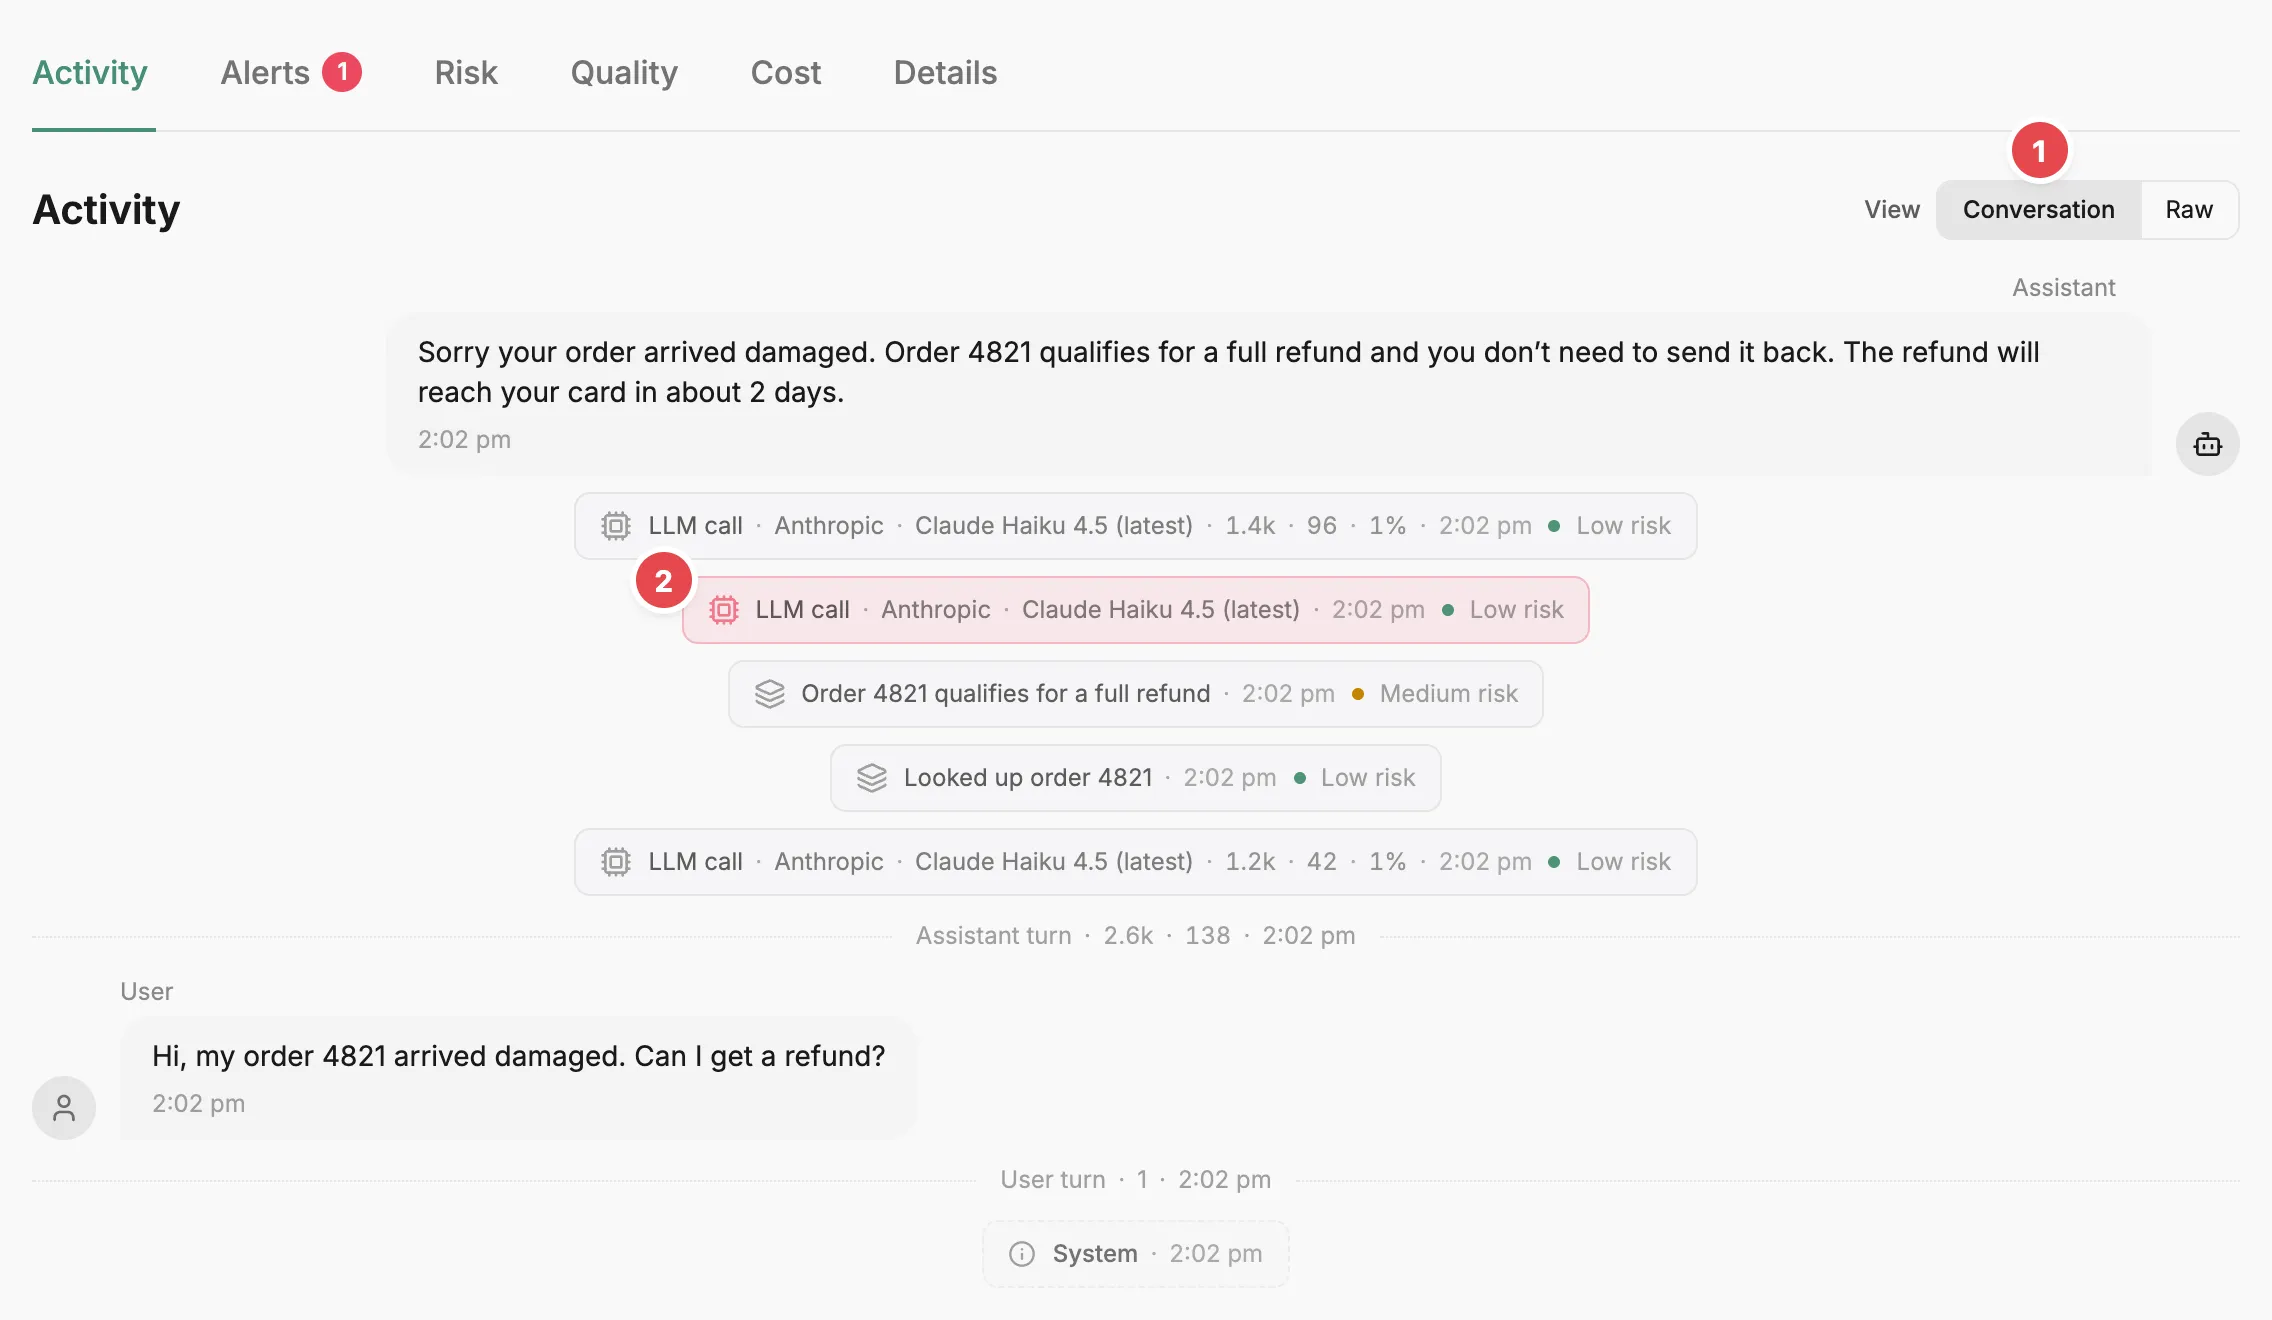
Read the spans on the Activity tab, one card per step.
If the agent uses a recognised integration, such as the Vercel AI SDK, LangChain, or the Claude SDK, the tab opens in Conversation view 1: user and assistant messages, tool calls and results, and LLM calls in order, newest first. Otherwise it shows the Raw span list. A failed step 2 is tinted red.
-
Select a span to open its detail panel.
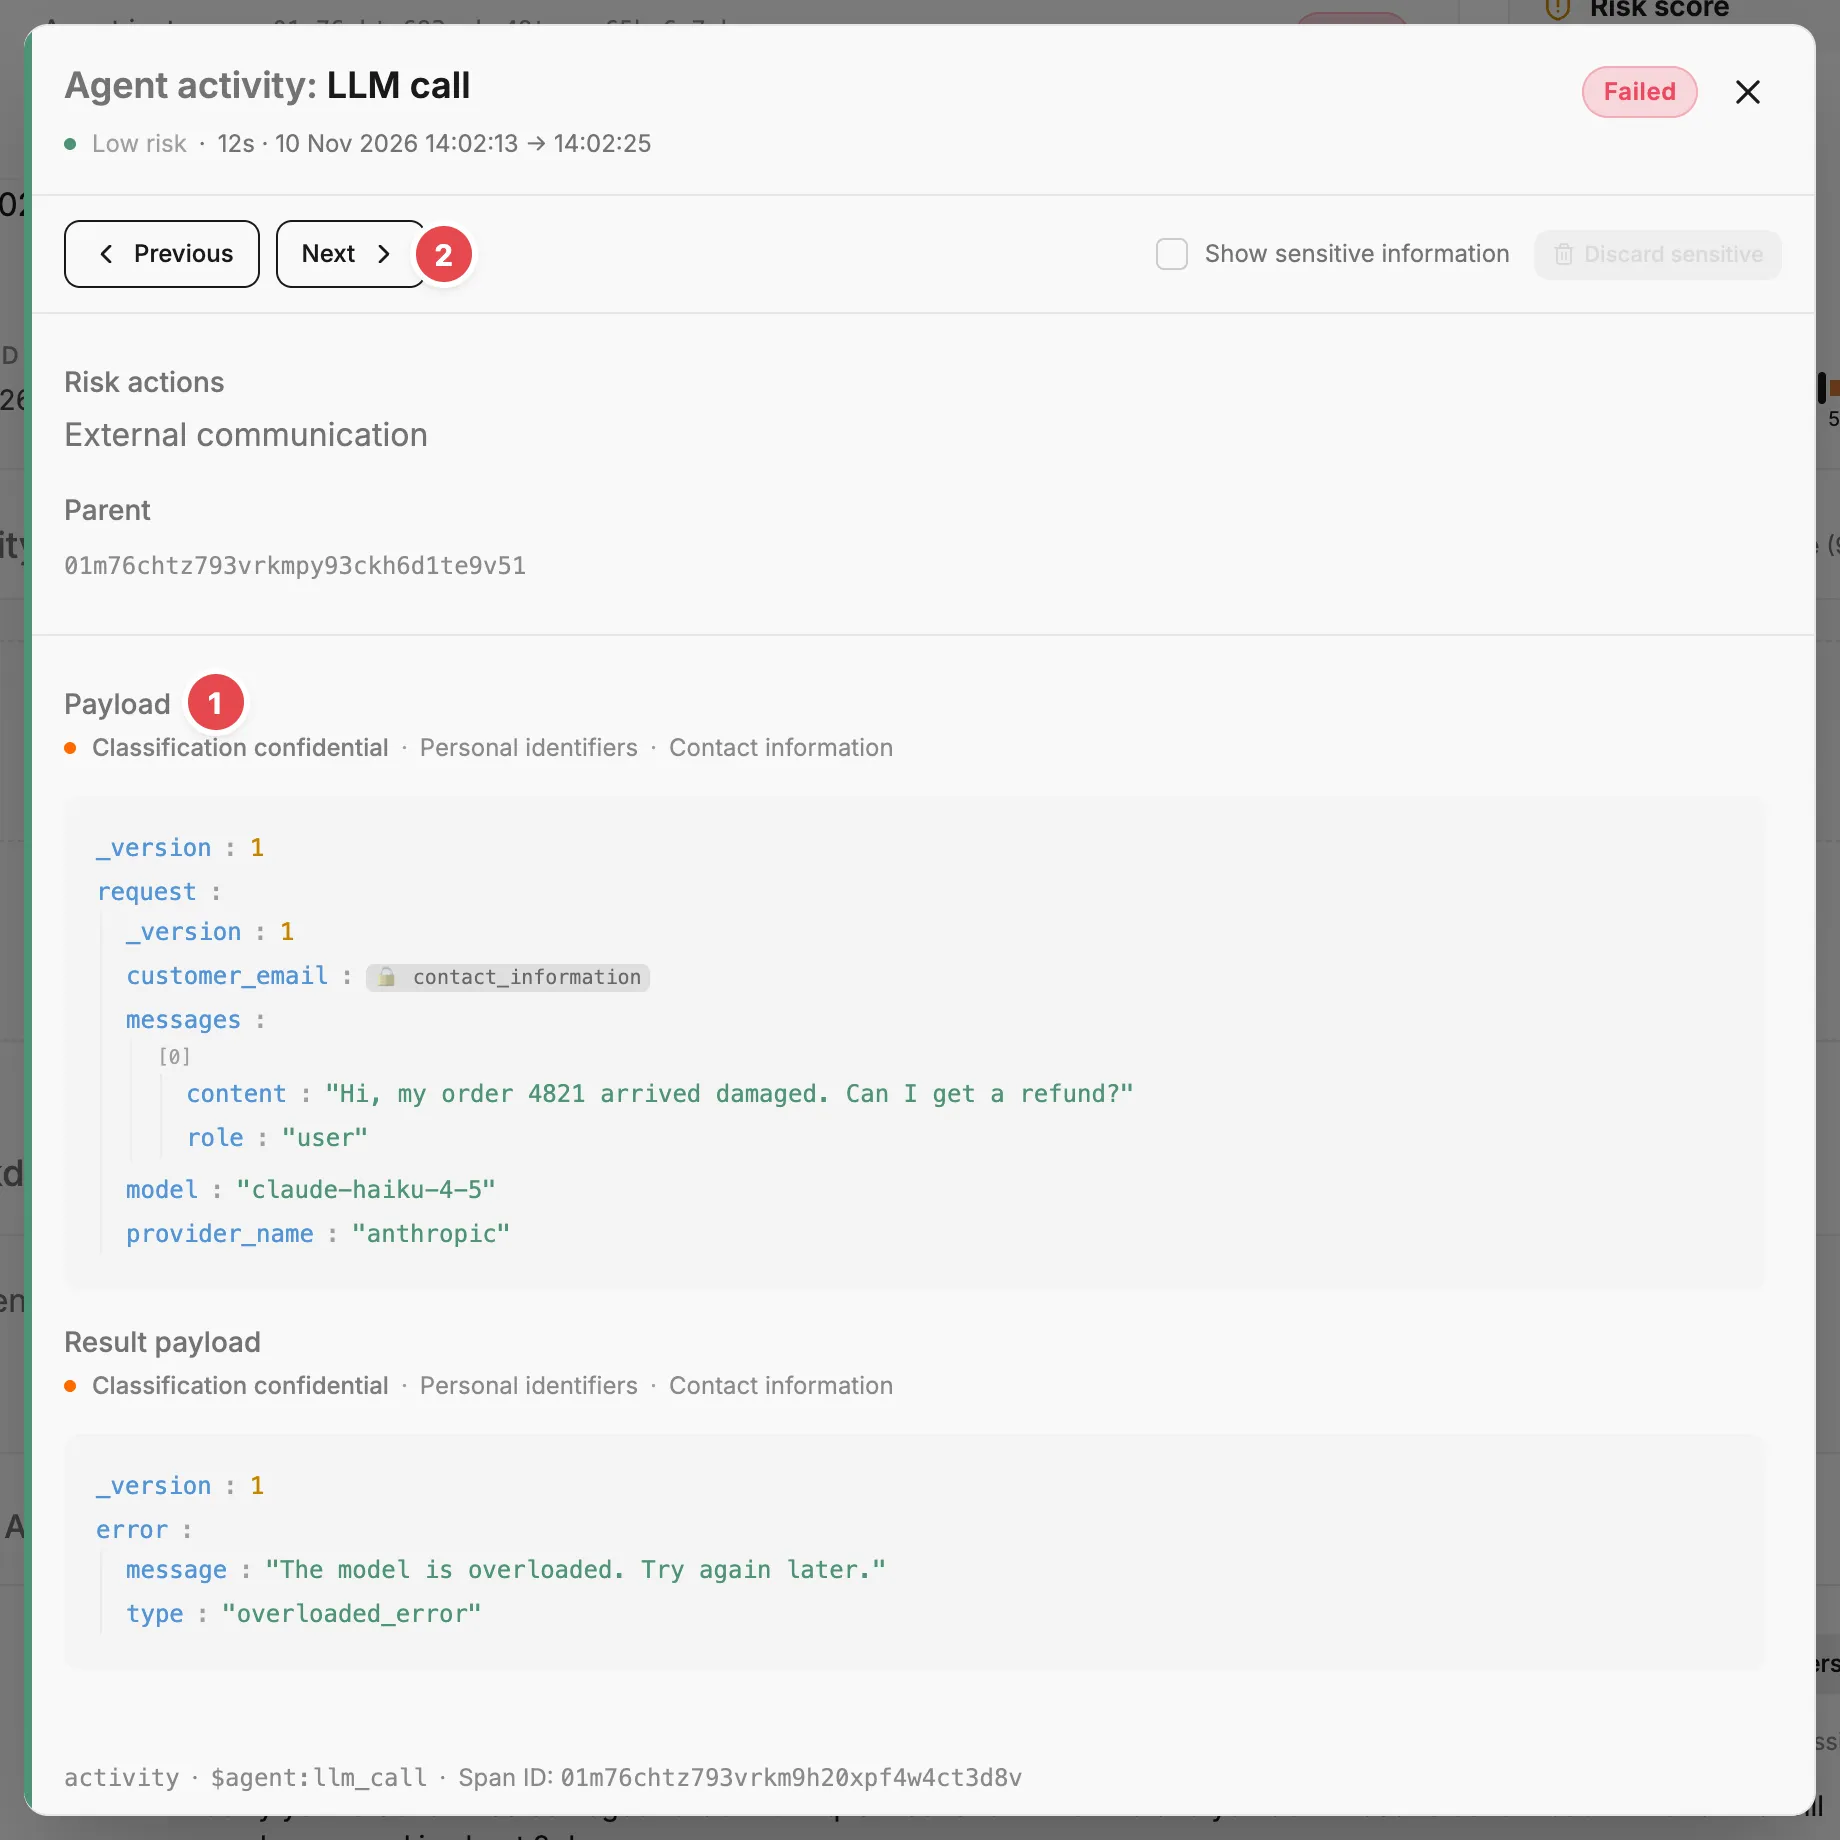
The panel shows the span’s status, risk level, duration, and timing, then its Payload 1, what the step received, and its Result payload, what it returned, each laid out as a tree. Use Previous and Next 2 to step through the run’s spans without closing the panel.
If the span holds values your integration marked as sensitive, they’re redacted. Tick Show sensitive information to reveal them until you leave the tab.
-
Select the Details tab to see the run as a whole.
You’ll see when it started and finished, which agent version ran, and the input, result, and metadata recorded for the run, when your integration records them.
Find out why it scored or alerted
Section titled “Find out why it scored or alerted”-
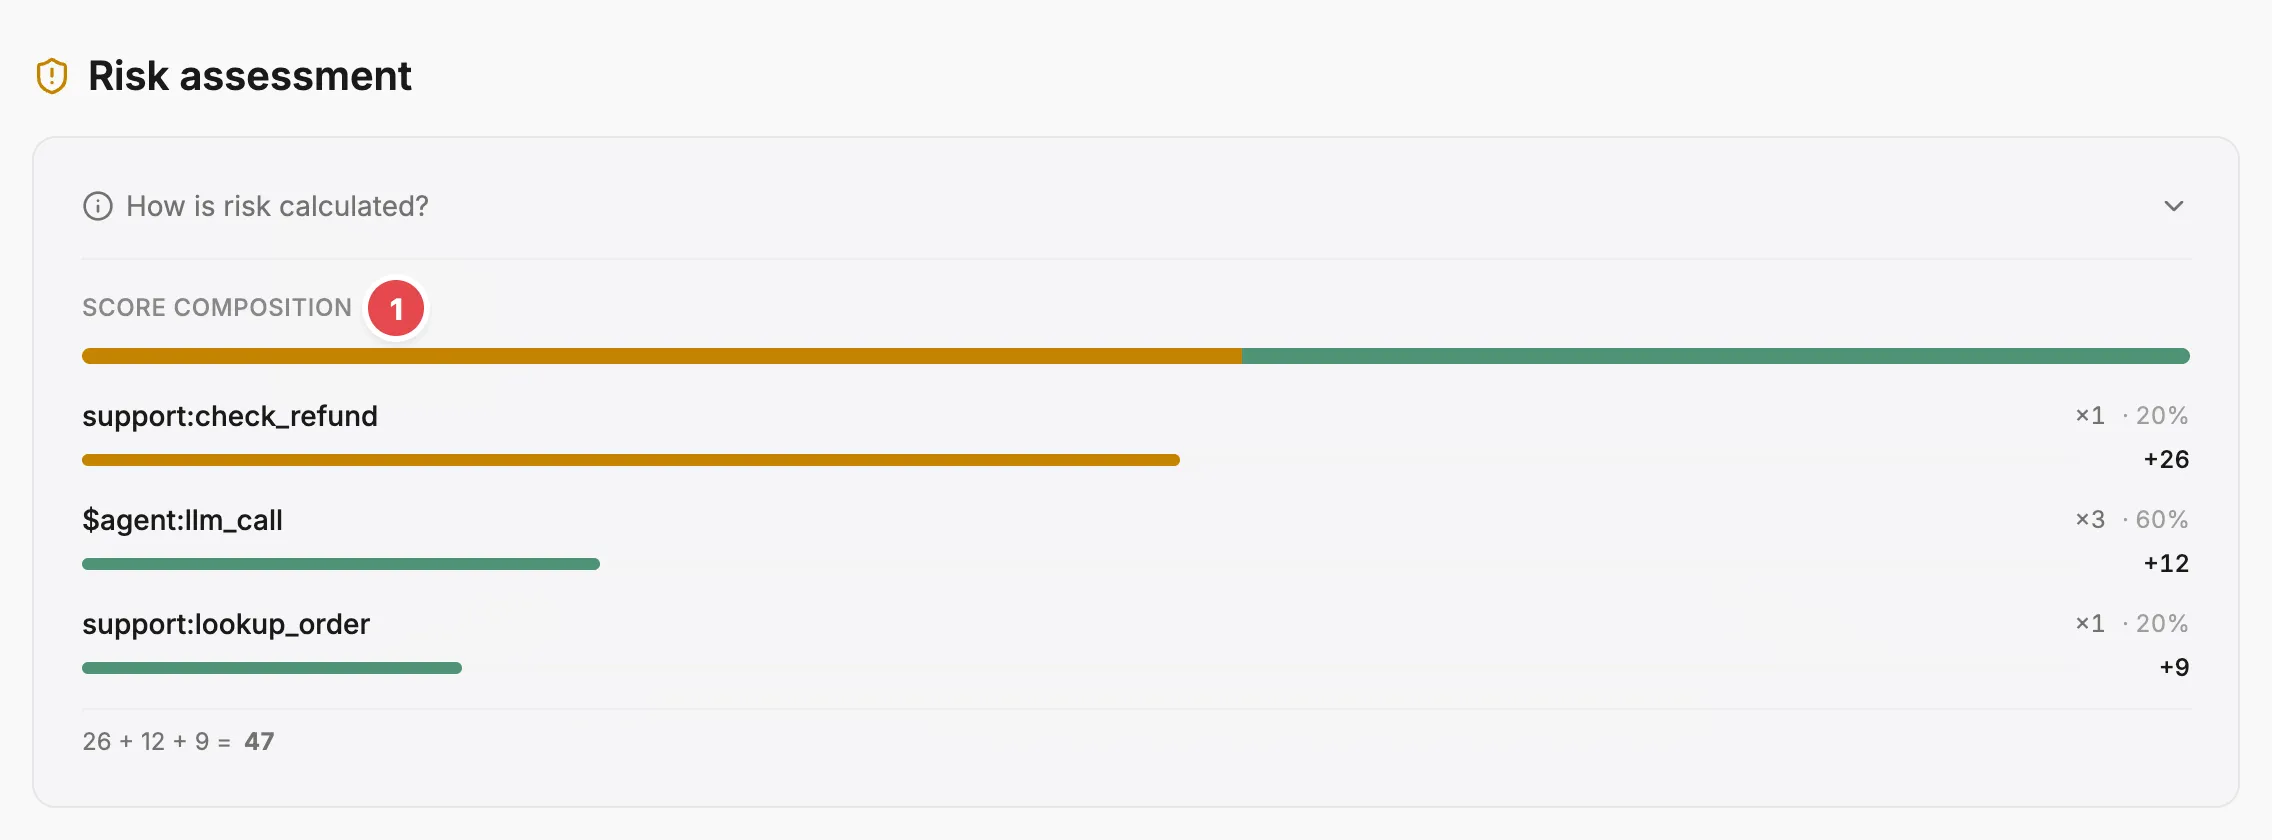
Select the Risk tab to see where the risk score came from.
The Score composition list 1 breaks the score down by span type: how many spans of each type ran, what share of the run’s scored spans they were, and how many points they added. Open How is risk calculated? for the rules behind it. The tab only appears when the agent has a risk profile.
-
Select the Alerts tab to see what was raised on the run.
Each alert shows its severity, when it was raised, and whether it’s still Active now. Select an alert to see its payload and history.
-
Select the Quality tab to see evaluation results.
Each quality schema and each judge attached to the agent gets its own section, with the verdict and the explanation behind it.
If the run is still Active and you need it to stop, open the ⋮ menu at the right of the strip, choose Terminate, and give a reason. Termination can’t be undone; see Handle instance termination for how the agent finds out.
If you can’t find what you need
Section titled “If you can’t find what you need”- The History tab is empty. The SDK hasn’t recorded a run for this agent yet. Check the agent ID and API token the SDK is using; see Configuration and environment variables.
- The run isn’t in the list. It may have run under a different agent. A deployment-scoped token supplies its own agent, so check which agent the token on the Deployments tab belongs to.
- There’s no Risk tab or Risk level column. The agent has no risk profile assigned. Assign one from the Risk page.
- The Activity tab shows raw spans instead of a conversation. The run’s spans don’t come from a recognised integration. The raw list holds the same spans; open each card to read it.
- A payload shows a placeholder instead of a value. The value was marked sensitive and either is redacted for your view or was discarded. See Sensitive data.
Related
Section titled “Related”- Instance — what a run is and the states it moves through.
- Span — what each step records.
- Agent instance page — every field and tab on the run’s page.
- Agent page › History tab — every column in the run list.
- The audit trail — what the connected record of a run contains.