

Check an agent's health
Before you dig into individual runs, it helps to know whether an agent is healthy overall: how many of its runs succeed, how long they take, and which step is slow or failing. The Metrics tab on the Agent page answers all three for a period you choose.
By the end you’ll know the agent’s success rate and failure count, whether its run times have a slow tail, and which step to look at first.
Before you start
Section titled “Before you start”- The agent has recorded runs in the period you want to check. Any role can read the Metrics tab.
- If you don’t know which agent to check, go to Home first. Needs attention lists the agents with failed runs or raised alerts in the period.
Open the Metrics tab
Section titled “Open the Metrics tab”-
Go to Agents and select View details on the agent’s card.
The Agent page opens.
-
Select the Metrics tab.
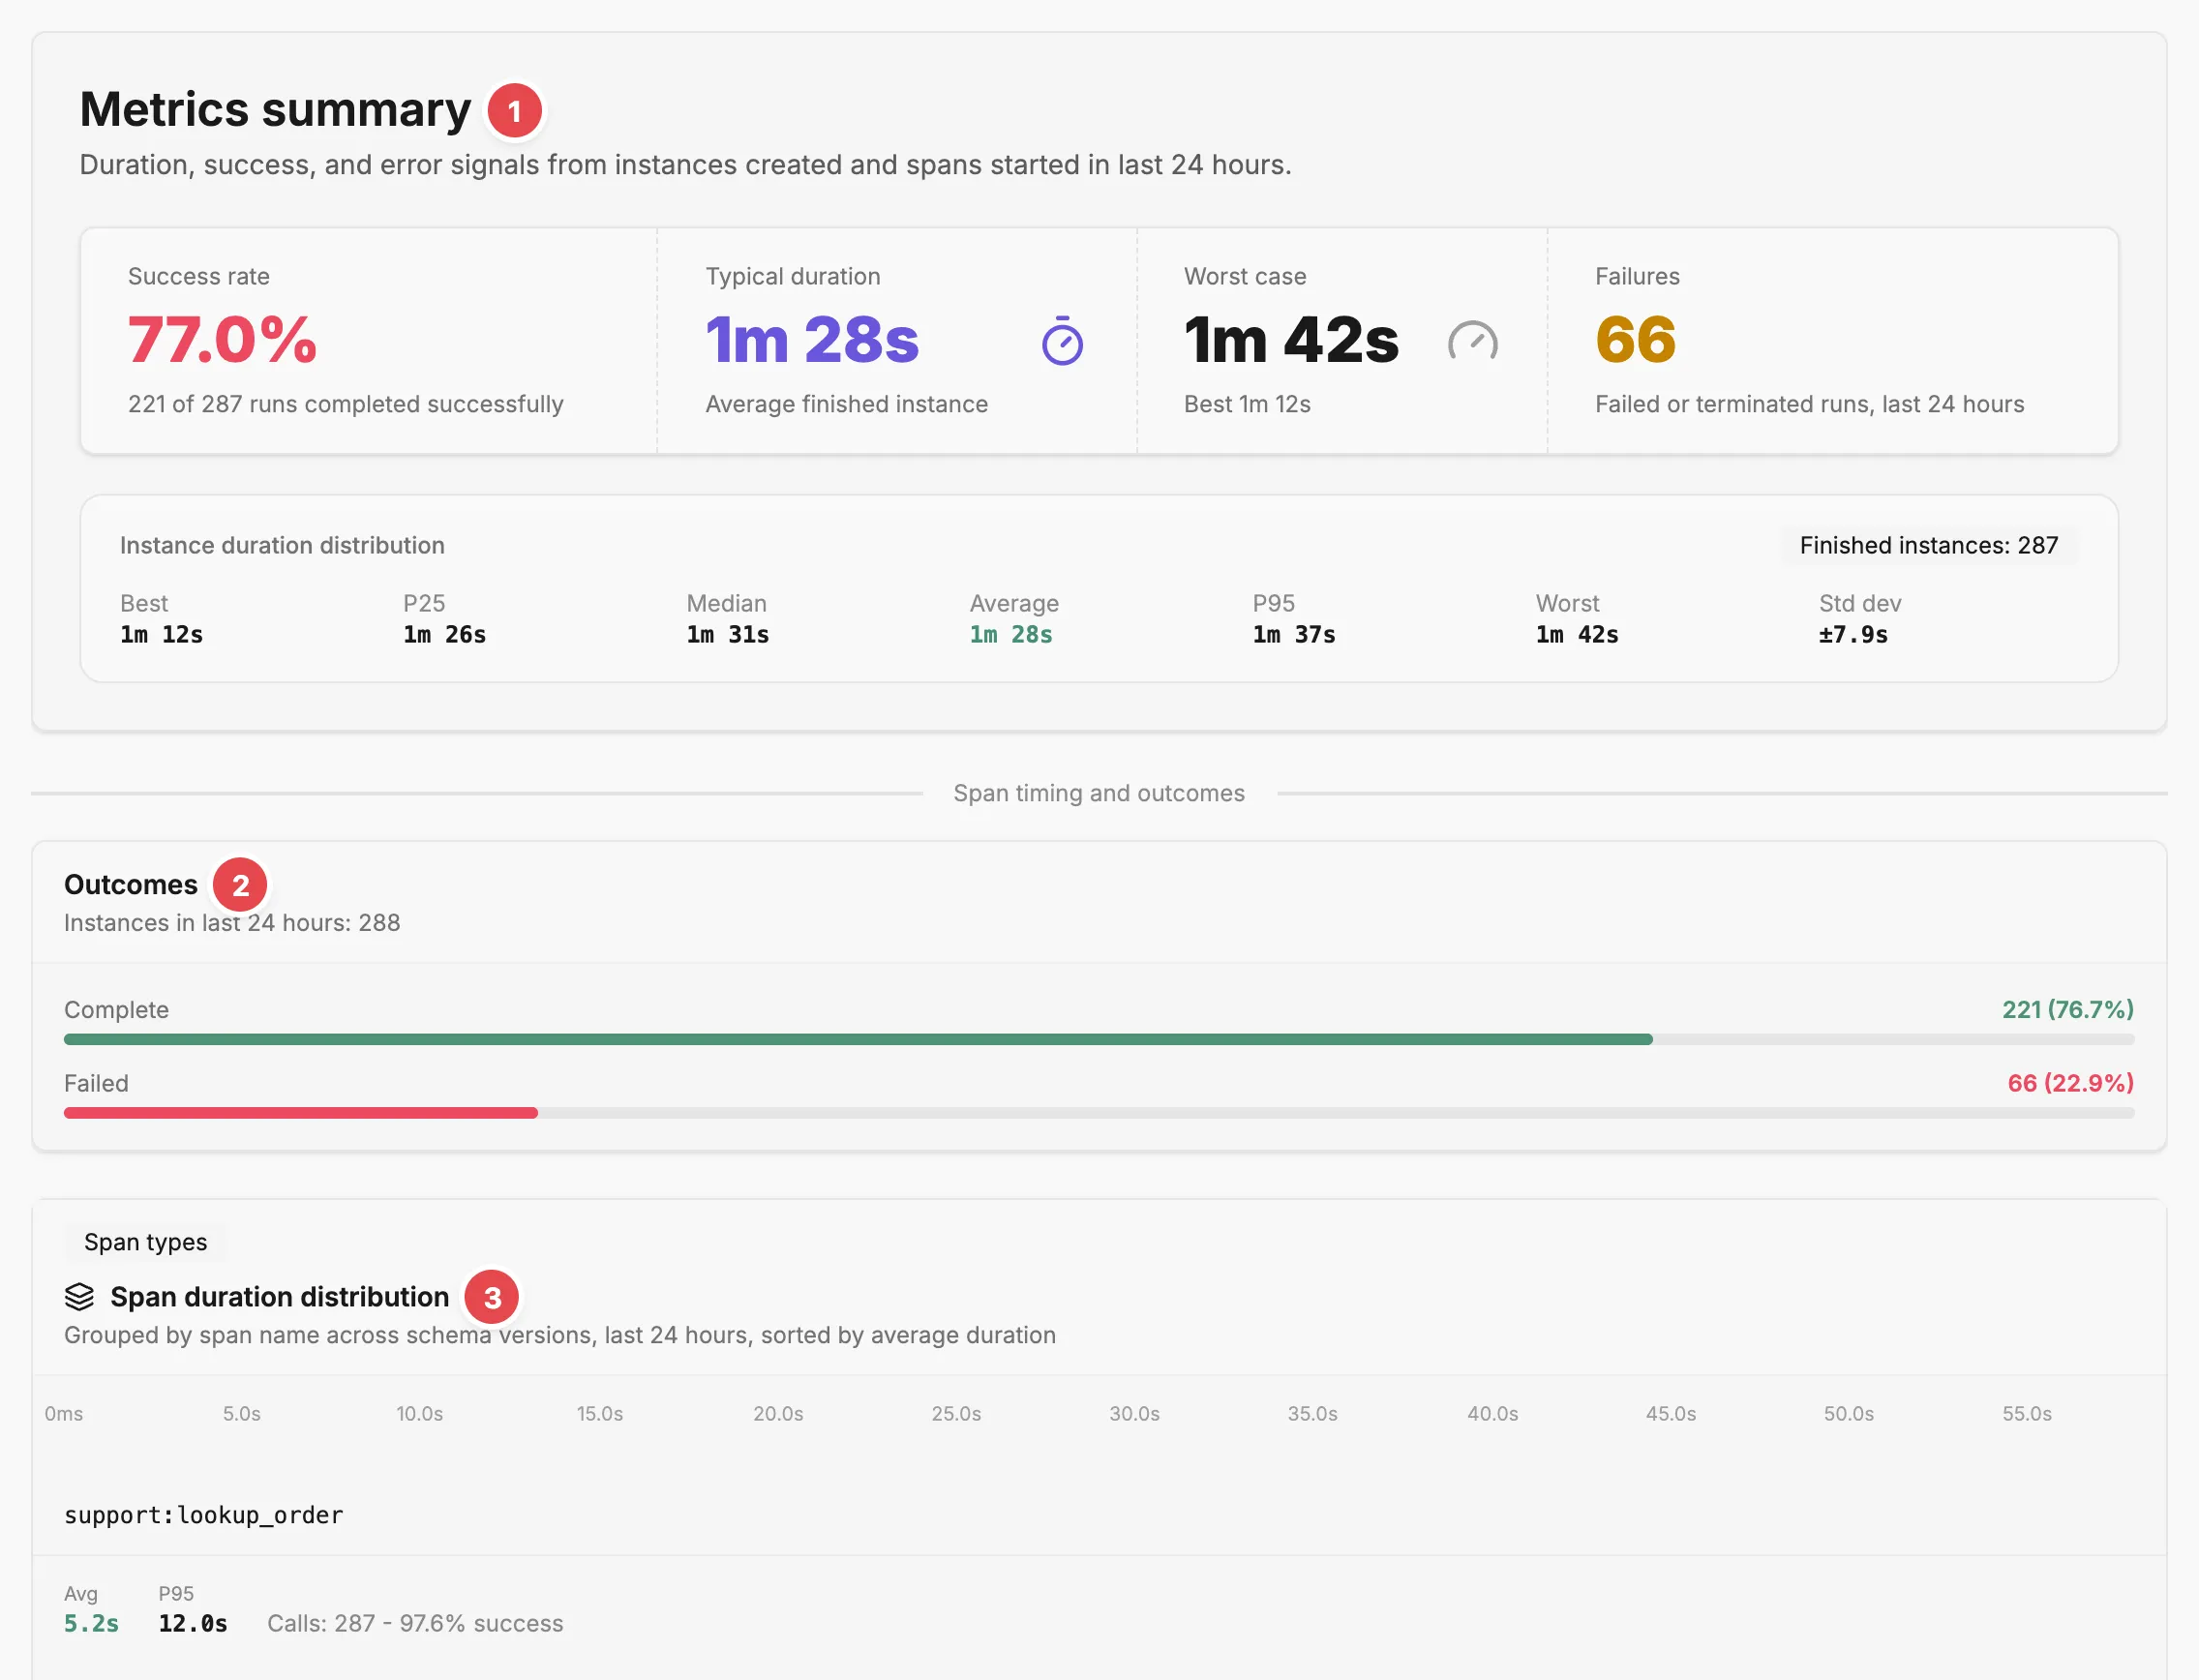
The tab starts with the Metrics summary card 1: four headline figures above a breakdown of run durations. Further down are Outcomes 2 and Span duration distribution 3, which the later steps cover.
-
Choose a period with the time range picker at the top of the page: 24h, 7d, or 30d.
Every figure on the tab updates. Runs count toward the period they were created in, and spans toward the period they started in.
Read the run figures
Section titled “Read the run figures”-
Read Success rate.
The line underneath, such as “42 of 45 runs completed successfully”, shows what the rate is based on. Only finished runs count, so runs still active don’t pull the rate down.
-
Read Failures.
This counts the runs that ended as Failed or Terminated in the period.
-
Compare Typical duration with Worst case, then read the Instance duration distribution below them.
The distribution gives Best, P25, Median, Average, P95, Worst, and Std dev for finished runs. A P95 far above the Median means a small share of runs take much longer than the rest, which an average alone would hide.
-
Read Outcomes, below Span timing and outcomes.
Every run in the period is counted by how it ended, with a share for each. Failed, Cancelled, and Terminated only appear when there’s at least one.
Find the step that’s slow or failing
Section titled “Find the step that’s slow or failing”-
Read the Span duration distribution.
Each span type gets a row, slowest average first, with its Avg, P95, call count, success rate, and a bar showing its spread from fastest to slowest on a shared time axis. A low success rate points at the step that’s failing; the top rows are where the time goes.
-
Open Details on a span type for its full spread and failure count.
You’ll see min, p25, p50 (median), p95, avg, max, and how many of its spans failed.
-
Select the History tab to open the runs behind the numbers.
Use the Status column to find a failed run, then follow Investigate a run.
If the numbers look wrong
Section titled “If the numbers look wrong”- The figures show a dash. No runs finished in the period. Choose a longer period, or check the History tab for runs that are still active.
- The run count doesn’t match the History tab. The Metrics tab counts runs by when they were created in the selected period. Runs created earlier don’t count, even if they finished inside it.
- A span type says “No finished spans for this type yet.” Its spans in the period are all still running, so there’s no duration to measure.
- The span list is empty. The agent recorded no spans in the period. Check that your integration is sending spans; see Configuration and environment variables.
Related
Section titled “Related”- Agent page › Metrics tab — every figure on the tab.
- Quality and performance — how run health relates to evaluation results.
- Instance — the run statuses the figures count.
- Span — the steps behind the span duration distribution.
- Home — the account-wide view, including Needs attention.
- Investigate a run — read one run step by step.