

Triage alerts
When your agents have raised alerts, you’ll want to deal with the most serious ones first and find out what each run was doing when it went wrong. Home lists every alert that is still raised across the account, so start there.
By the end you’ll have worked down the open alerts by severity, read the details behind each one, and know how each will clear.
Before you start
Section titled “Before you start”- You’re signed in to the account the agents belong to. Any role can review alerts.
- To stop a run from the web app, you need the Full access role.
Find the open alerts
Section titled “Find the open alerts”-
Go to Home.
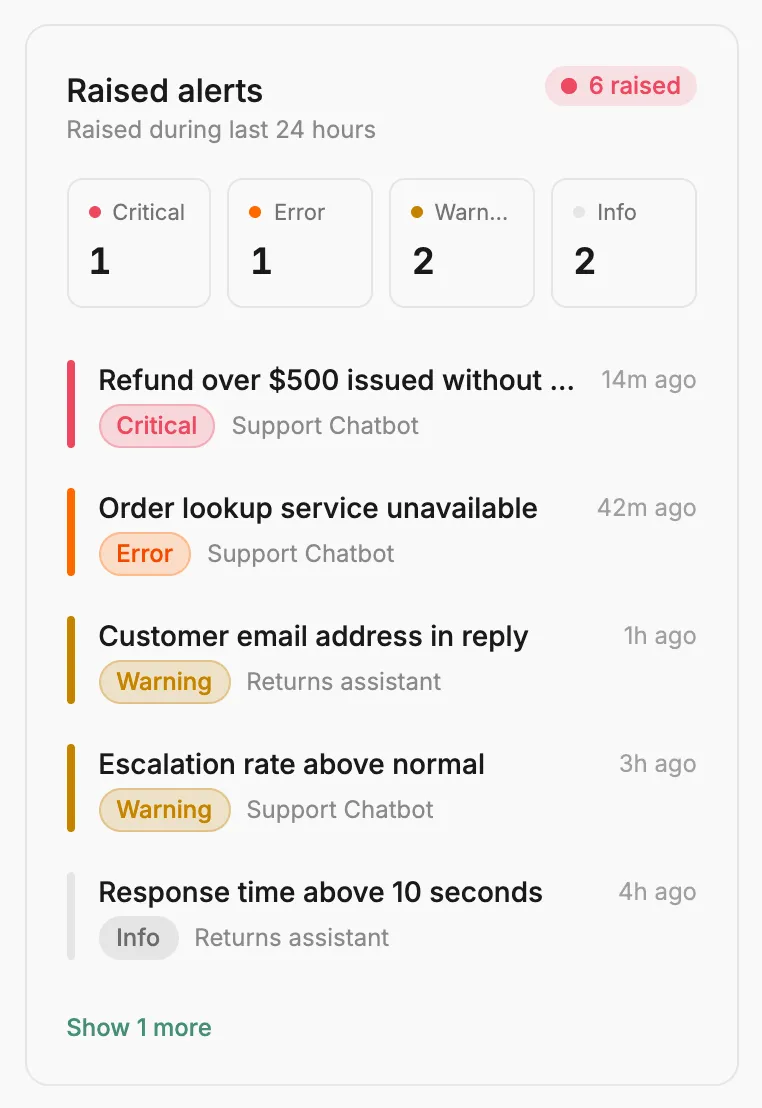
The Raised alerts tile at the top counts the alerts that are still raised, split by severity. The Raised alerts panel below lists them, most serious first, each with its severity, agent, and how long ago it was raised.
-
Choose a period with the time range picker at the top of the page: 24h, 7d, or 30d.
The panel lists every alert that’s still raised and was active during that period, so an alert raised before the period still shows.
-
Select a severity, such as Critical, to show only alerts of that severity.
Severities with no alerts can’t be selected. Select the severity again, or Show all severities, to see everything. Use Show n more when the alert you want isn’t in the first few.
Read an alert
Section titled “Read an alert”-
Select an alert in the panel.
The Agent instance page › Alerts tab opens for the run that raised it. Every alert on that run is listed with its title, summary, severity, and timing. One that hasn’t cleared is marked Active now.
-
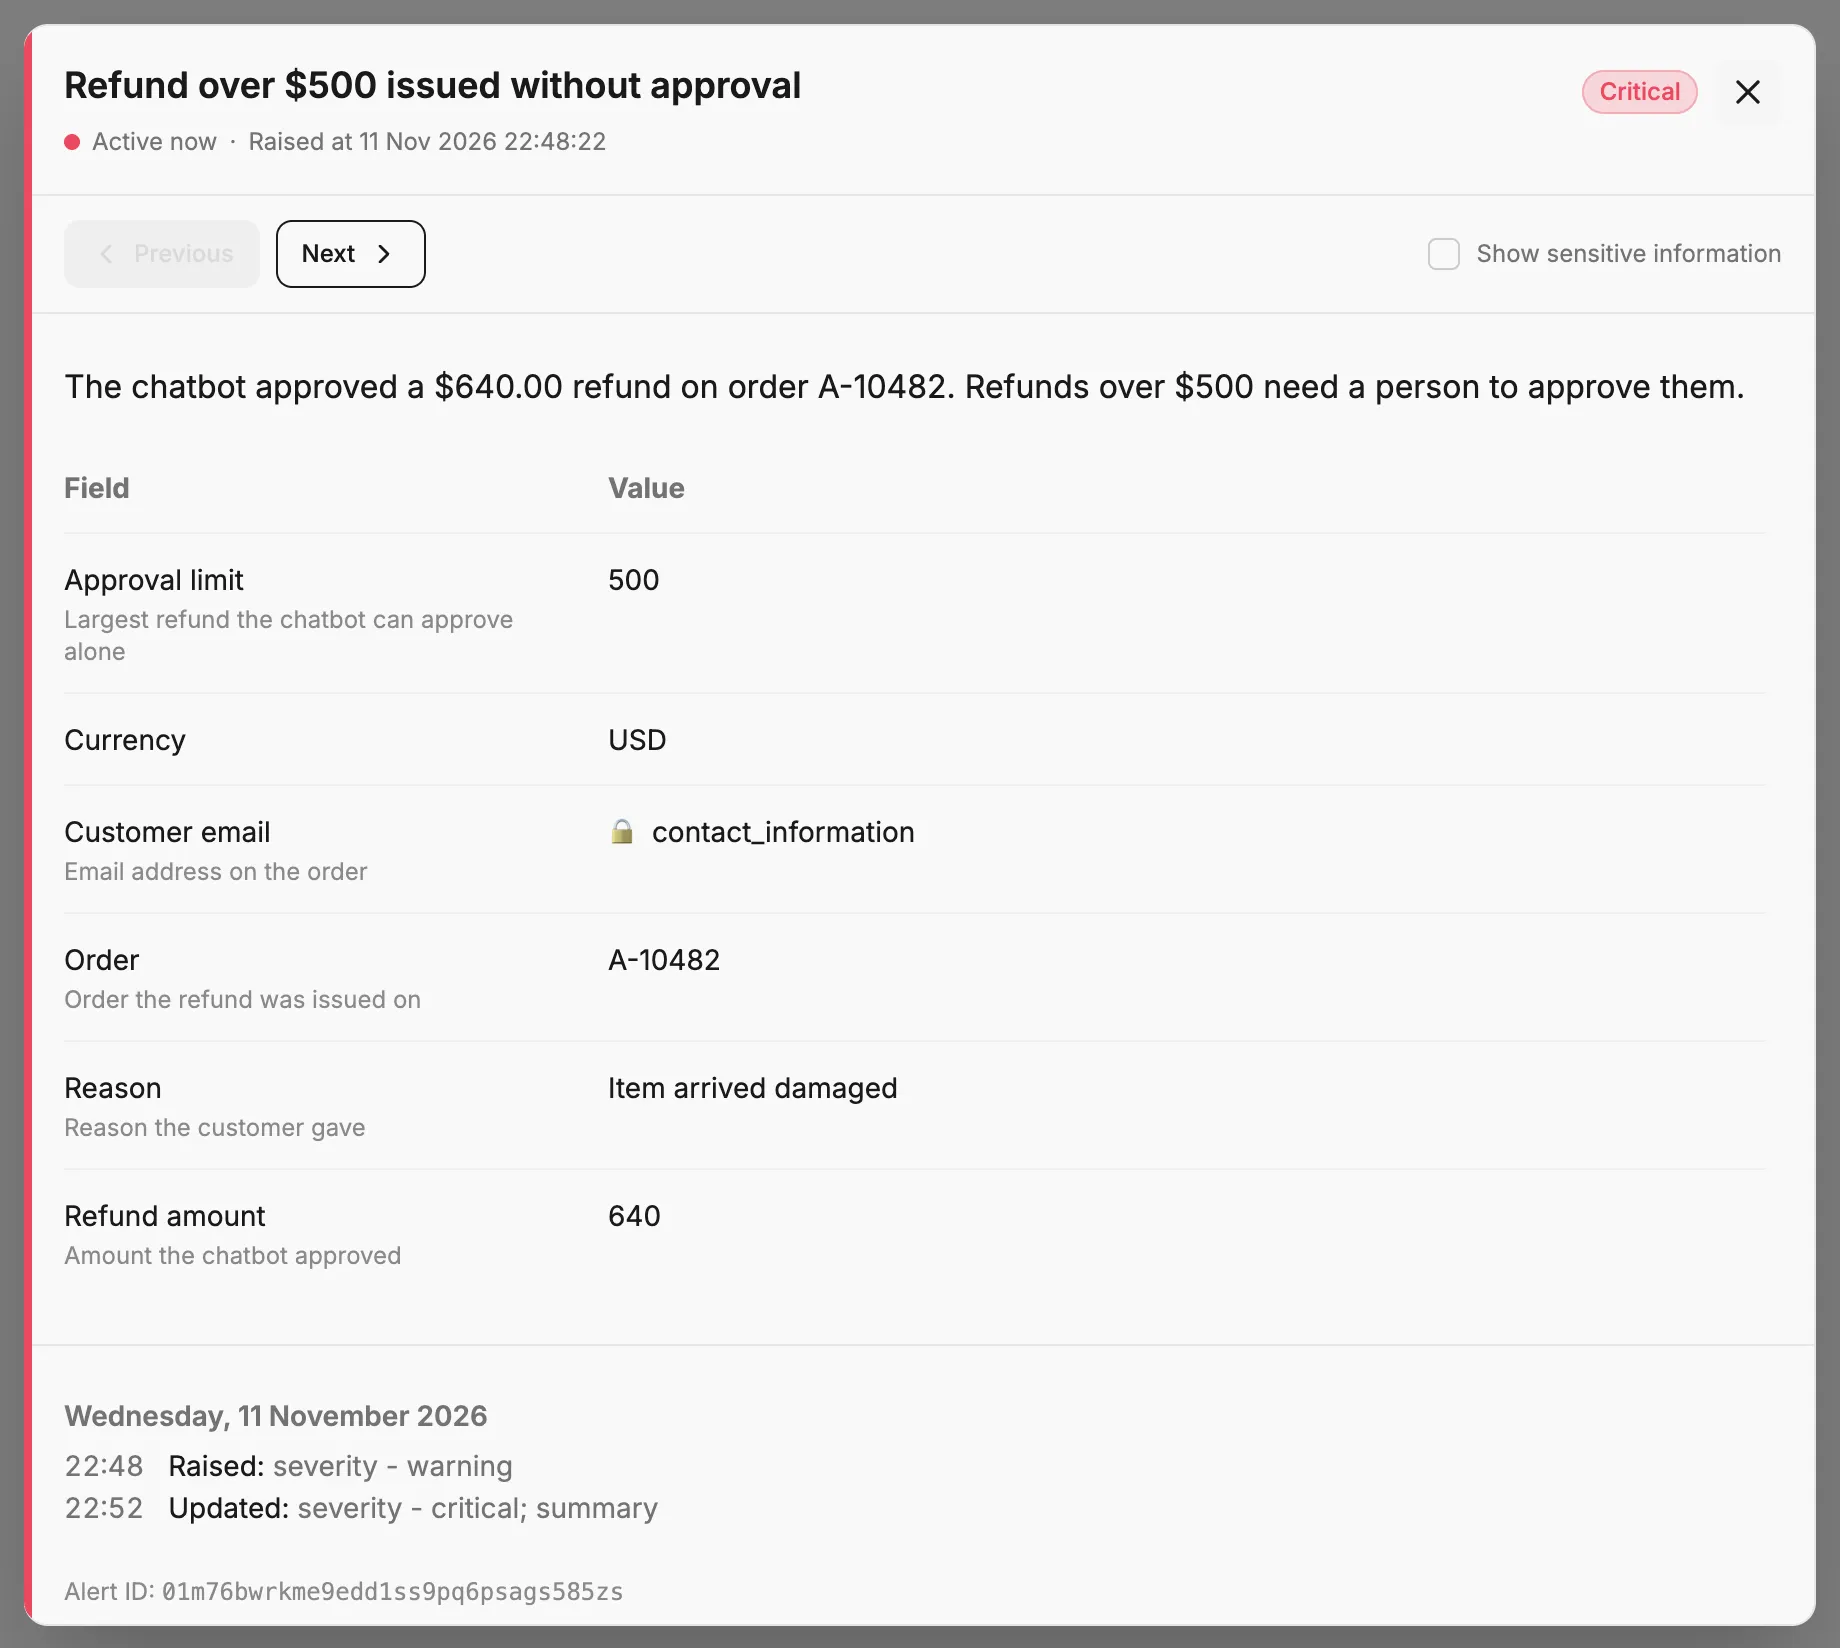
Select the alert in the list to open its details.
The details show the alert’s payload as a table of fields and values, then its history: when it was raised, updated, cleared, or re-raised. Use Previous and Next to step through the run’s other alerts. If the payload holds values marked as sensitive, tick Show sensitive information to reveal them.
-
Select the Activity tab to see what the run did around the time the alert was raised.
Investigate a run covers reading the spans and their payloads.
Act on it
Section titled “Act on it”-
If the run is still Active and needs to stop, open the ⋮ menu at the right of the strip at the top of the page, choose Terminate, and give a reason.
The run’s status changes to Terminated. Termination can’t be undone; see Handle instance termination for how the agent finds out.
-
Fix the cause, and let the alert clear.
There’s no button to clear an alert in the web app. Alerts Prefactor raises from an agent’s threshold rules clear when the cause goes away, such as a slow run finishing or a quiet run recording a new span. Alerts your own integration raised clear when your integration clears them. Alert lists how each rule clears.
Verify
Section titled “Verify”A cleared alert drops off the Raised alerts panel on Home. On the run’s Alerts tab it loses Active now and shows the time it was raised and the time it cleared.
If it didn’t work
Section titled “If it didn’t work”- The panel says there are no raised alerts, but you expected some. The alert has already cleared. Find the run on the agent’s History tab and check its Alerts column.
- A “Failed live instances” alert never clears. That rule counts every failed live run the agent has ever had, so it clears only when you raise the limit or turn the rule off. See Failed instances.
- The same alert comes back after clearing. Raising an alert shortly after it clears reopens the same alert rather than creating a new one. Its history shows each Re-raised entry.
- The Terminate dialog shows an error when you confirm. Your role is Read only. Ask a Full access user to stop the run.
- A payload value shows a placeholder. The value is sensitive and either hidden from your view or discarded. See Sensitive data.
Other ways to do this
Section titled “Other ways to do this”To list raised alerts from a script, call GET /api/v1/alerts. Your integration clears the alerts it raised with POST /api/v1/alerts/clear.
Related
Section titled “Related”- Alert — severities, who raises alerts, and how they clear.
- Home — the Raised alerts panel and the rest of the account summary.
- Agent instance page › Alerts tab — every alert on one run.
- Investigate a run — read what the run did, step by step.
- Send notifications to Slack — get a message when an alert is raised or clears.