

Metrics tab
Operational signals for the agent: whether runs are completing, how long they take, and where the failures are. Come here when you want to know if the agent is healthy before digging into individual runs. The figures cover instances created and spans started in the time range selected at the top of the page.
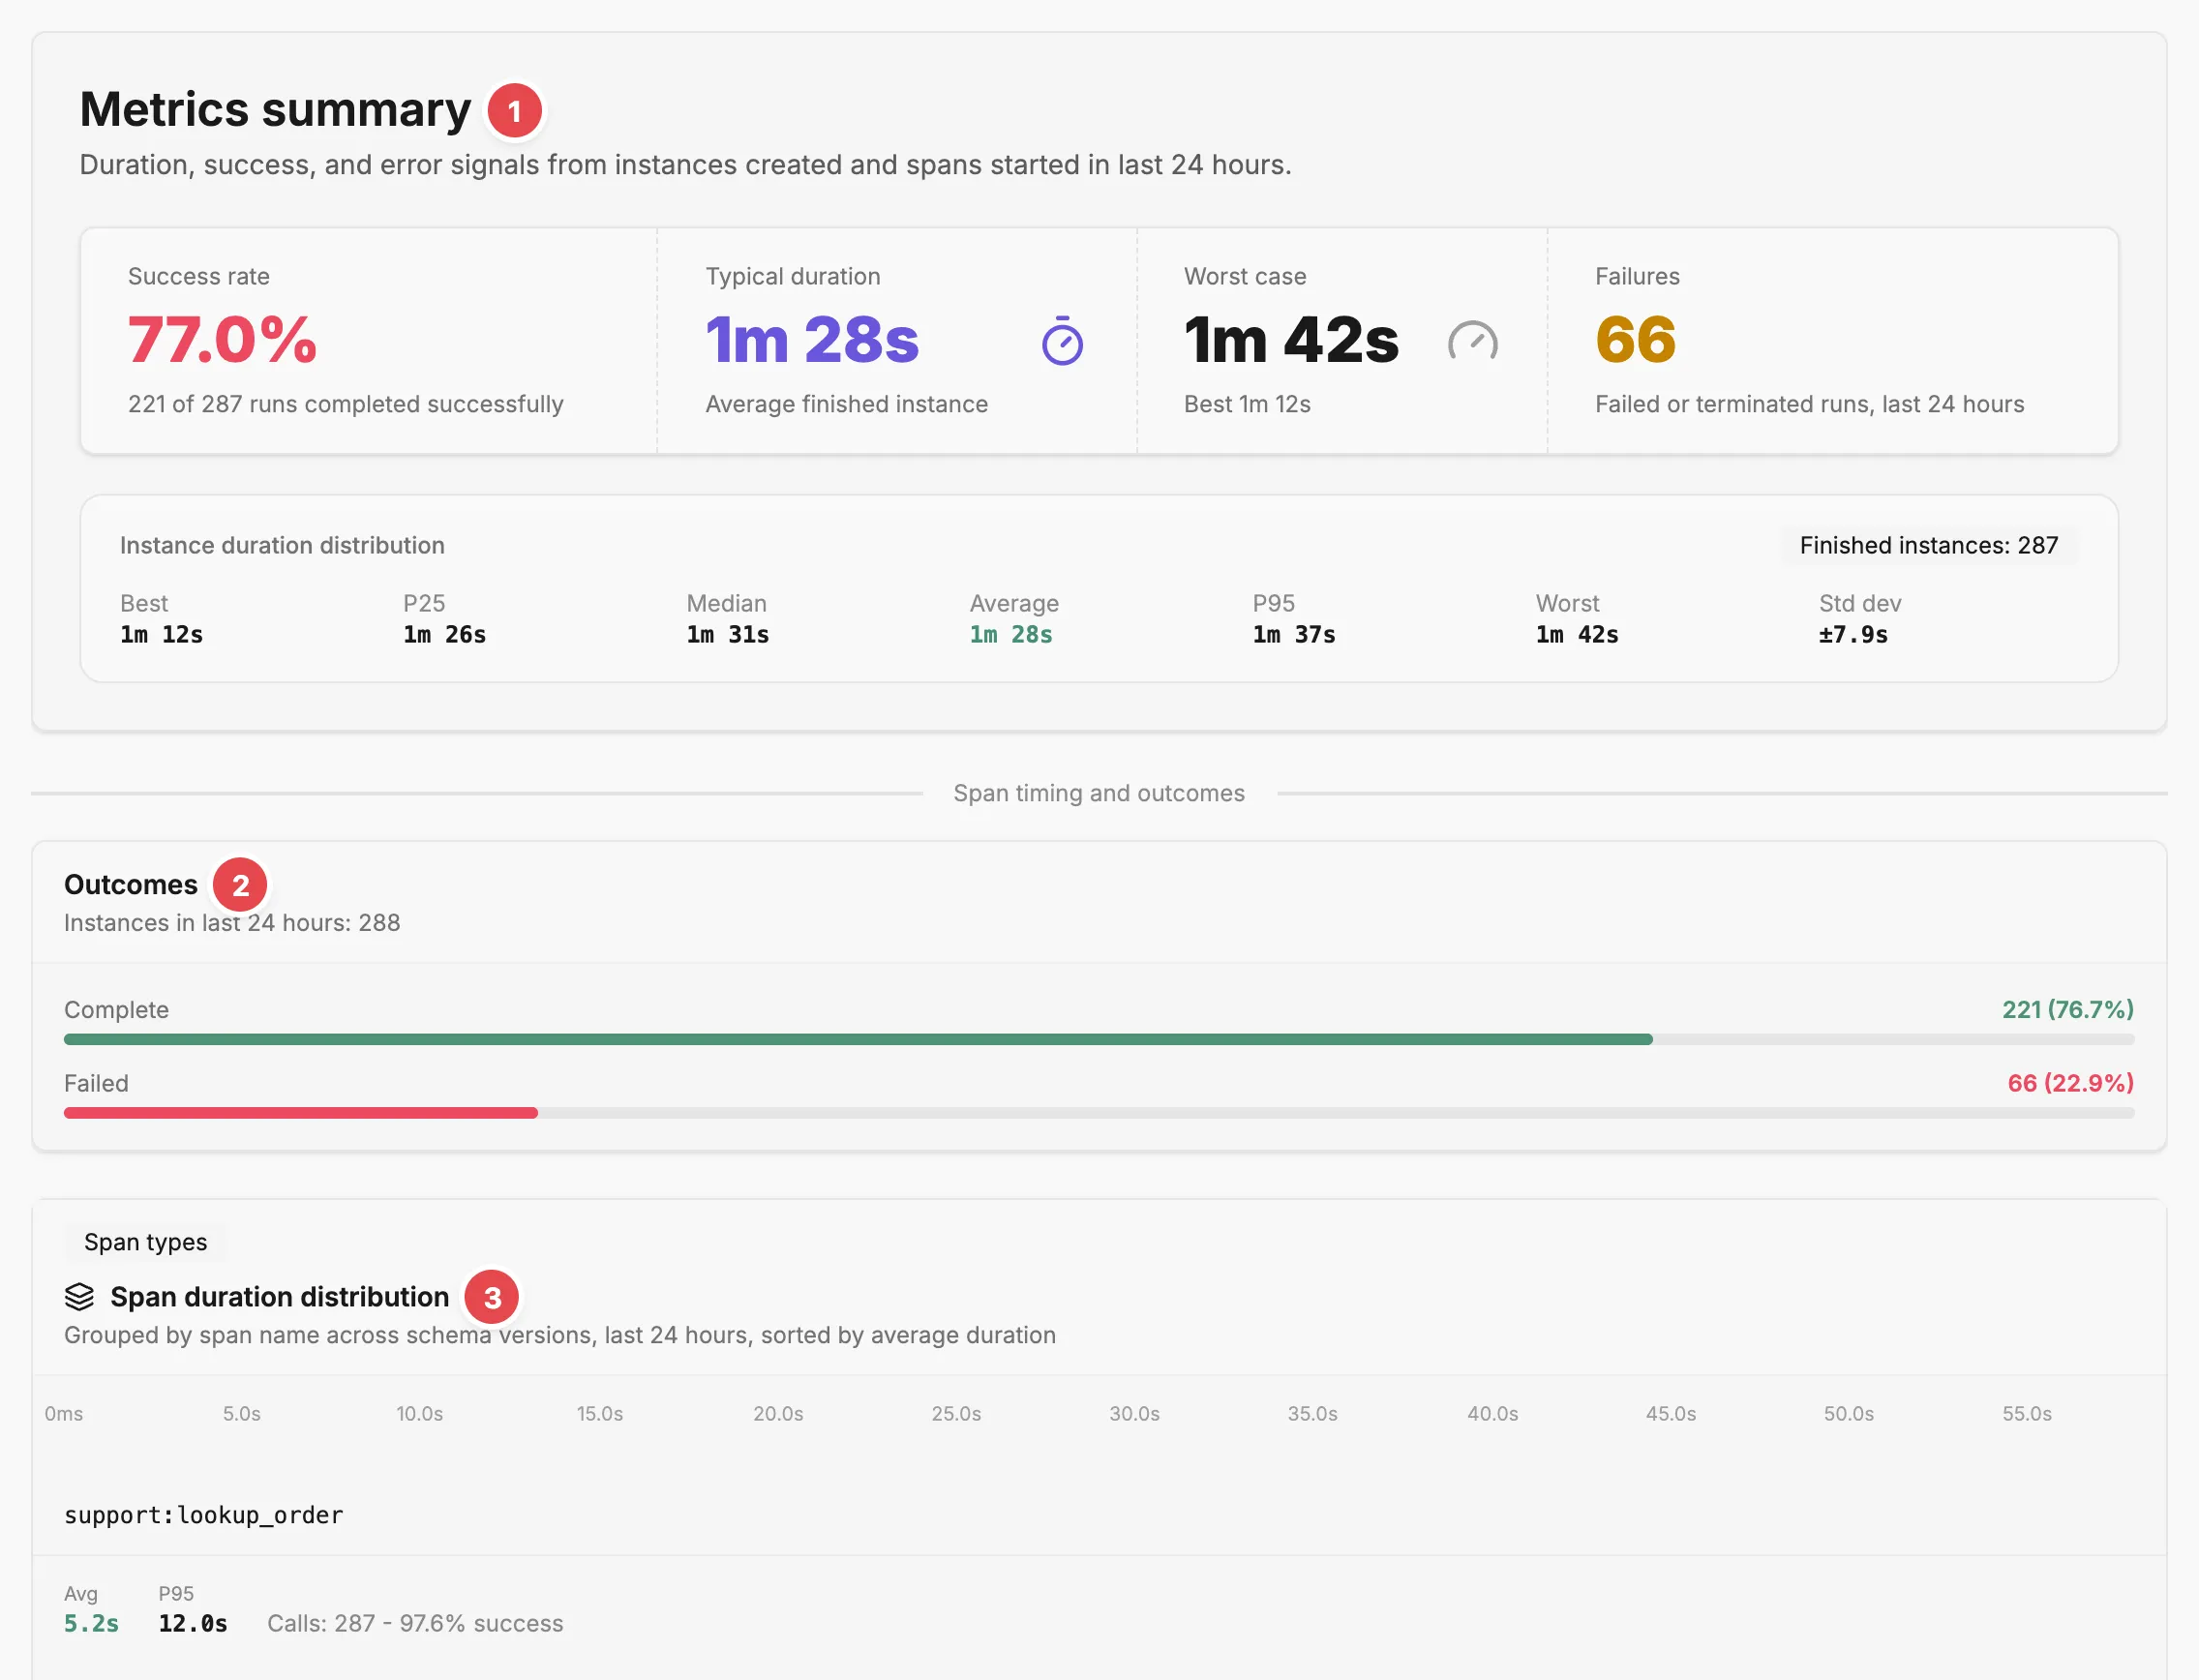
- Metrics summary - success rate, durations and failures for the range.
- Outcomes - how each run in the range ended.
- Span duration distribution - timing for each span type, slowest first.
For the strip that stays visible above the tabs, see the Agent page. For quality evaluations of individual runs (scores and verdicts rather than run health), see the Agent › Instance › Quality tab. A judge has the same tab on its Judge page, measuring its own runs.
Metrics summary
Section titled “Metrics summary”Four headline figures for the selected range:
- Success rate — the share of finished runs that completed. A run counts as finished once it is Complete, Failed, Cancelled, or Terminated.
- Typical duration — the average duration of finished runs.
- Worst case — the longest finished run, with the shortest shown underneath as Best.
- Failures — runs that finished as Failed or Terminated.
Below them, the Instance duration distribution breaks finished runs down by Best, P25, Median, Average, P95, Worst, and Std dev, so a healthy-looking average cannot hide a bad tail.
Outcomes
Section titled “Outcomes”Every instance in the range by how it ended, with counts and percentages of the total. Complete always appears; Failed, Cancelled, and Terminated appear only when at least one run ended that way. Runs still in progress count towards the total but have no row of their own.
Span duration distribution
Section titled “Span duration distribution”The same timing analysis at span level, grouped by span type across schema versions and sorted by average duration. Each span type shows its Avg and P95 duration, how many calls it made, and its success rate, with a plot of its duration spread on an axis shared by all span types, so the slowest step in the agent’s workflow stands out. Expand Details under a span type for its min, p25, p50 (median), avg, p95, and max durations, and how many of its spans failed.
Only activity spans are counted; quality spans written by the platform are left out.
Related
Section titled “Related”- Quality and performance — what quality means for an agent and how evaluations work.
- Instance — the run-level record these statistics aggregate.
- Span — the step-level record behind the span statistics.
- Agent page › History tab — drill through to the individual runs behind the numbers.
- Agent › Instance › Quality tab — the quality evaluation attached to a single run.